8.0 What the roadmap is, and what it is not
The operator has computed the score (Sections 4 and 5), identified the zone (Section 6), and followed the mechanics through the worked example (Section 7). Section 8 answers the last open question of this paper. What should an operator do in the next twelve months so that the score, at the deal date, carries the target zone with maximum weight?
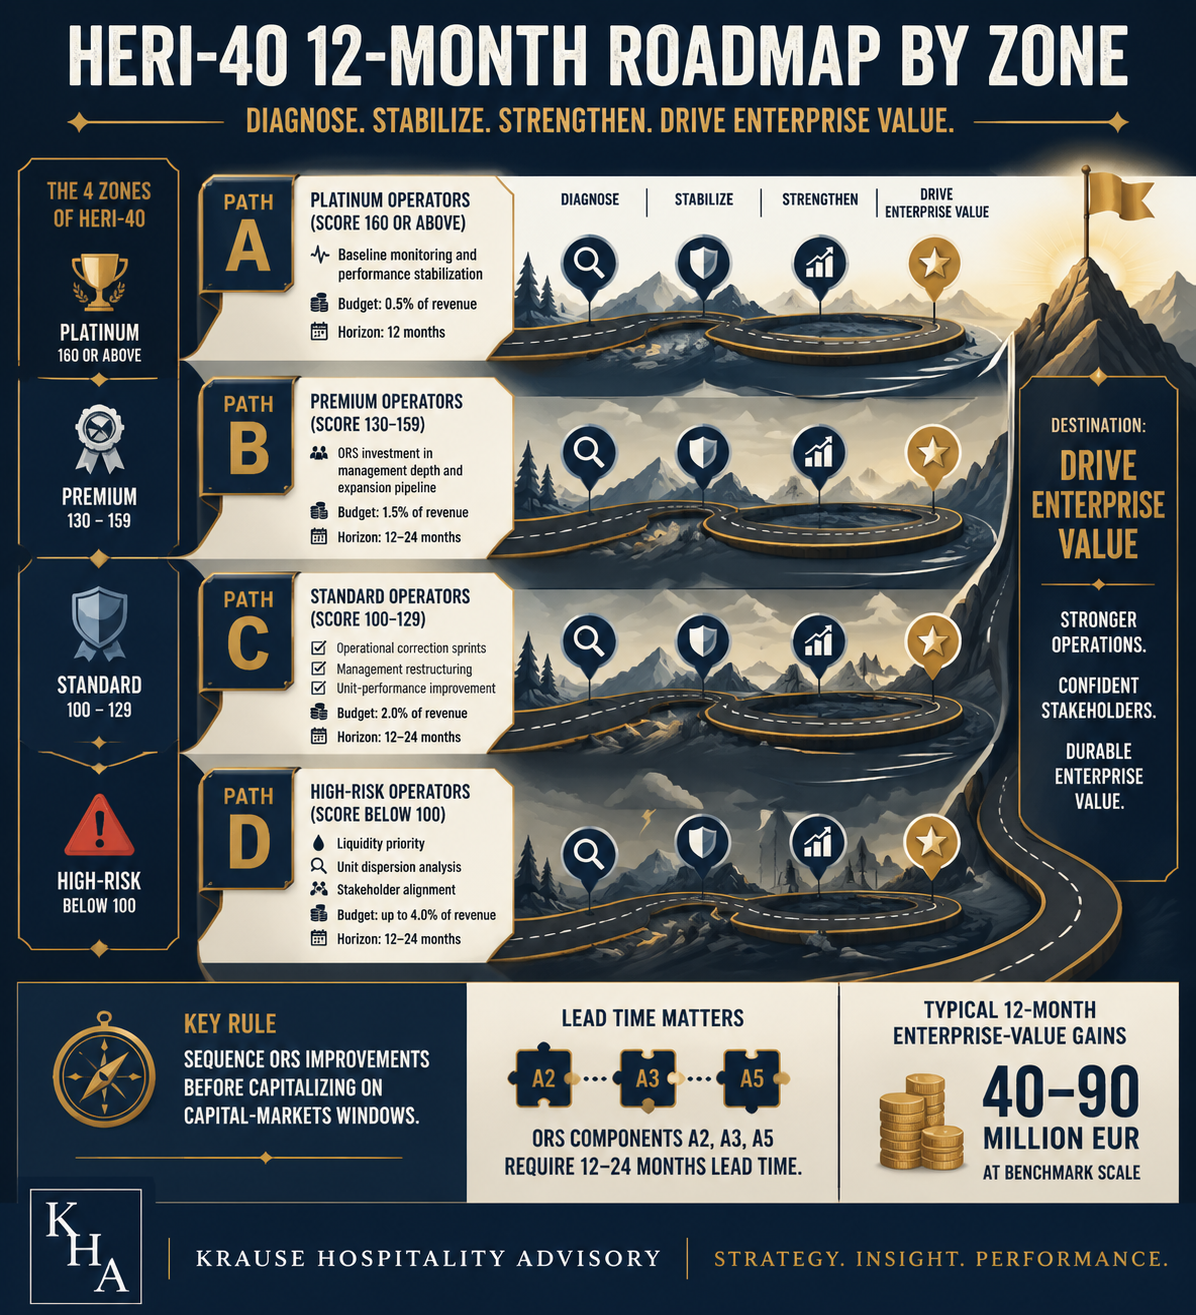
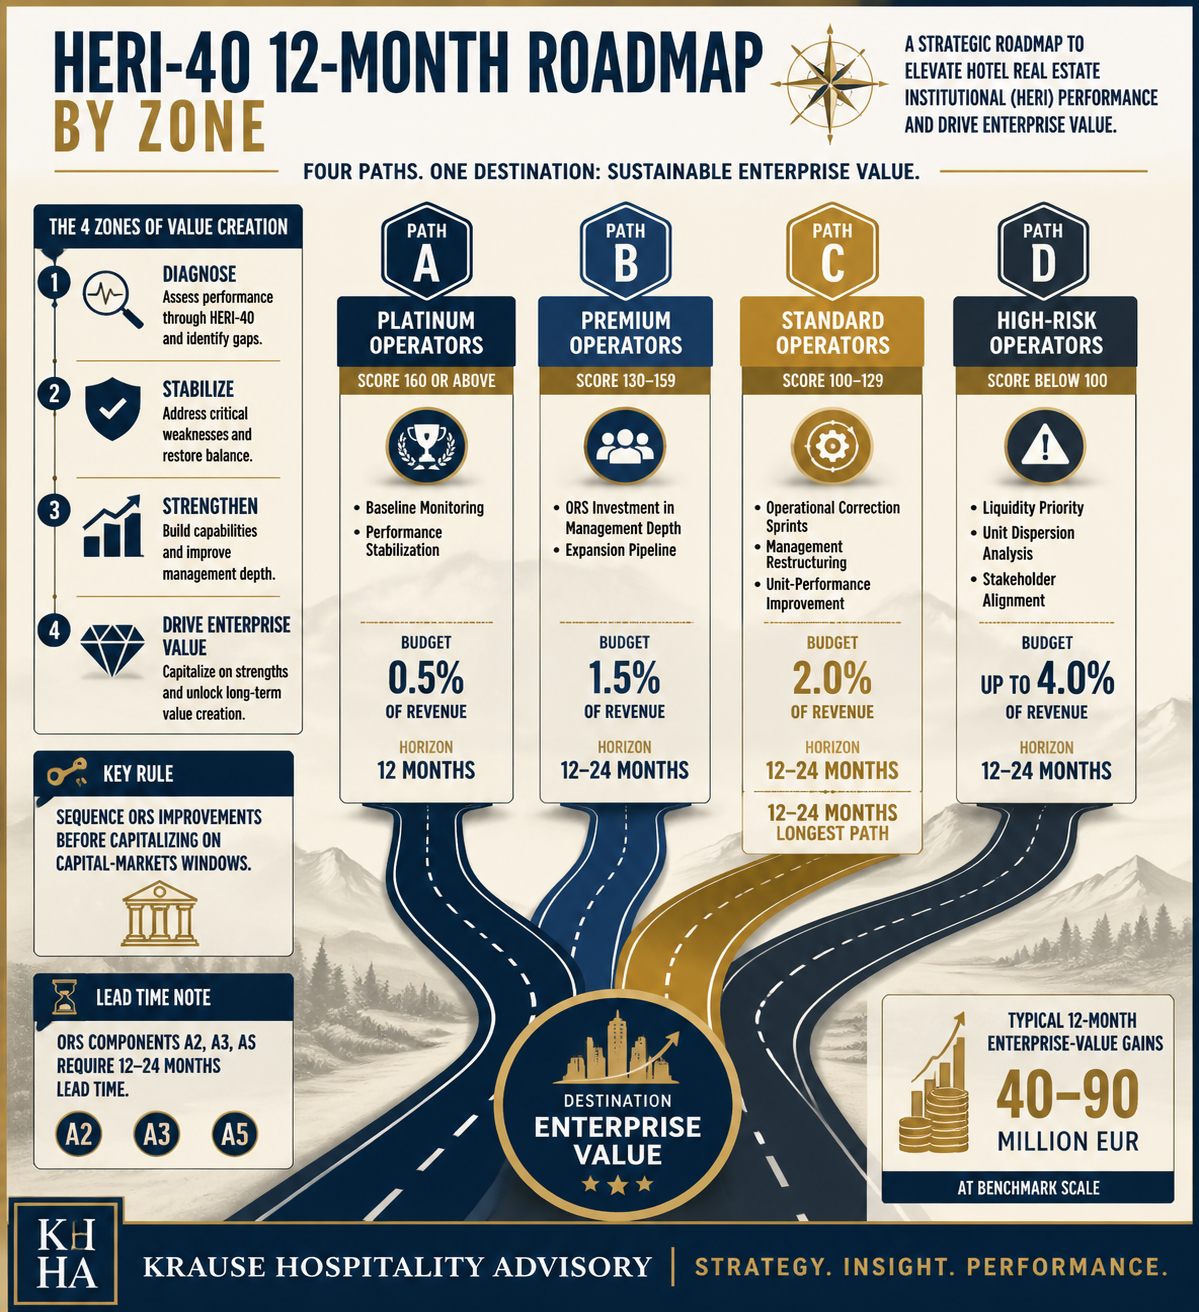
The answer decomposes into four paths, one per zone. Path A for Platinum defence from score 160 upward, Path B for the Premium climb to the Platinum border, Path C for the Standard climb into the Premium zone, and Path D as a triage note for High-Risk scores below 100. Each path contains quarterly milestones, investment bandwidths, and quantitative go/no-go criteria. All budget figures are stated as bandwidths, referenced to a benchmark operator with 100 units, EUR 150 million in revenue, and a 15 percent EBITDA margin — a typical multi-unit hospitality profile that scales linearly to the reader's own chain size.
What Section 8 does not deliver: it does not replace advisory work, it does not substitute for case-specific tailoring, and it does not guarantee a score increase. It supplies a frame inside which the operator decides, and it names the two methodological anchors from Section 7 on which all four paths rest. First: ORS components A2, A3, and A5 are investment decisions with twelve to twenty-four months of lead time, not market gifts (Section 7.7). Second: MTS components B1, B2, and B4 are primarily timing-driven — the same chain can oscillate between mid-Premium and the Platinum border through a quarterly shift of the sale window alone (isolation scenarios in Section 7.6). The governing logic for every upward path follows: ORS work first, identify the MTS window as a target quarter, bring both together at the deal date.
8.1 Path A — Platinum defence (score 160 and above)
Starting position: the score already sits inside the Platinum zone. Buyer types are in view — strategic acquirers with a hospitality portfolio, or large-cap private equity sponsors with a proprietary sector track record. A process is running or is six to twelve months out. The core risk for the next twelve months is no longer score build-up, but score preservation between signing and closing. Due-diligence periods of six to nine months are the real value destroyer in the Platinum zone, as the Del Taco zone migration from Section 6.3 illustrates in reverse: a score that slips by five to ten points during the DD period costs two to four multiple points at closing reconciliation, or more.
Q1 — baseline fixation. Freeze components A1 to A5 and B1 to B4 on a quarterly basis as a reference score. A monthly monitoring dashboard with a component check makes slippage visible early. Priority on A3 (management depth): retention of the second leadership line, no key departures during the process. Typical Q1 investment: monitoring infrastructure EUR 50,000 to EUR 120,000 one-off, retention packages for key personnel in the range of 0.2 to 0.5 percent of revenue on a recurring basis.
Q2 — unit-performance stabilisation. The typical Platinum danger sits in A2 (unit-EBITDA dispersion). New expansion cohorts with unit economics not yet matured depress the median ahead of closing. Countermeasure: pipeline pause, no new site openings with expected below-median performance in the final two quarters before signing. In parallel, cultivation of B3 (buyer signal) through sponsor IR, conference presence, trade-press interviews — do not build new, but do not let it rest either.
Q3 — deal preparation. Data-room consolidation, a quality-of-earnings mandate to a sector-experienced audit firm, management presentation. A5 whitespace documentation for the buyer-upside story: which five to ten qualified expansion sites sit in the pipeline? Typical Q3 budget: advisor mandate from signing usually one to two percent of deal value, QofE mandate EUR 150,000 to EUR 400,000.
Q4 — process start or score traffic-light check. If the process is running, the task is stabilisation through closing. If the process has been deferred by two to three quarters, re-baseline the score components and decide whether to continue the defence path.
Typical 12-month budget for the defence path: 0.5 to 1.5 percent of revenue in additional opex. Go/no-go criterion: if the score slips below 155 during the DD period, either pause the process or communicate the valuation bandwidth transparently between 155 and 160. A silent acceptance of the descent leads to a trust collapse in the DD phase; active communication protects a large share of the already negotiated price level.
The negotiation dynamic of the Platinum zone during DD deserves a separate look, because it differs structurally from the Premium and Standard zones. In Platinum processes there are typically two to four qualified bidders, and the score reconciliation takes place as a rule in the fourth DD month, when QofE results arrive and the buy-side reads the operating dataset against the management presentation. A score dent of five points that was not anticipated in the signing memorandum shifts the negotiation position asymmetrically at that stage: the bidder does not request linear price adjustment but structural renegotiation, frequently with earn-out insertion, tightening of the MAC clause, or escrow uplift. The multiple points taken from the score weigh double in deal value because they simultaneously generate structural cost. Active stewardship of score stability between signing and closing is therefore not comfort work but the hardest capital-protection task of the Platinum zone.
8.2 Path B — Premium to Platinum (score 130 to 159 toward 160 and above)
Starting position: the score sits in the Premium band, the distance to the Platinum border is one to thirty points. The diagnostic entry question reads: which two components are holding the chain back? Two typical pictures crystallise from the Premium gap patterns of Section 6.2. First, an ORS-side gap in A3 (management depth) or A5 (whitespace quality) with a typical potential of five to ten points per component at twelve to eighteen months of lead time. Second, an MTS-side gap in B1 (sub-segment multiples) or B4 (capital-markets window) with five to fifteen points of potential, primarily timing-driven. The realistic horizon to the Platinum border lies at fourteen to twenty-four months, depending on entry score and lever combination.
The two gap patterns require different execution logics. ORS gaps are investments with a plannable time path: senior hires have a ramp-up curve of six to nine months, whitespace qualification a validation curve of two to three quarters, A4 cohort maturation requires operational discipline across eight to twelve quarters. MTS gaps are market windows: the capital-markets window opens and closes along high-yield-spread movements, the IPO window along hospitality transaction counts, both independent of the ORS. The diagnostic consequence for the path is clear: prioritise the ORS gaps in execution sequence, keep the MTS window visible as a target quarter, but do not force it against a headwind.
Q1 — gap diagnosis. Which two A components deliver ten or more points, which two B components are probable to move upward in the next four to six quarters? The answer requires a structured audit. If the diagnosis lands on A3: management-bench analysis, gap identification in the second leadership line, hiring plan for two to three senior roles. If the diagnosis lands on A5: external site-selection mandate, qualification of the pipeline for viable site formats, not for wish geographies. Typical Q1 budget: EUR 80,000 to EUR 250,000 for external diagnostic mandates, EUR 200,000 to EUR 500,000 in internal opportunity cost.
Q2 — execution, A component one. Where A3 is priority: hospitality-specialist recruiting mandates for two senior hires, negotiation of the comp packages, onboarding. Typical cost envelope for the new roles: EUR 300,000 to EUR 800,000 annually per role, plus recruiting fees of 20 to 30 percent of annual salary. Where A5 is priority: site-selection partner for five to ten qualified locations, concept tests at two to three pilot units.
Q3 — execution, A component two. In parallel to the first component, the second begins so that the levers compound rather than run sequentially. Additionally, activation of the MTS watchlist (thresholds in 8.5) so the window is not missed while the operator works on ORS. Q3 budget depends on the second component: A3 in total 0.6 to 1.5 percent of revenue per year, A5 in the range of 0.3 to 0.8 percent.
Q4 — score re-baseline and deal-window decision. Two paths are now open. Either process start in the next two to three quarters under a favourable MTS signal (at least two of four watchlist indicators green) and an ORS score above 170 as a buffer against MTS volatility. Or a further six months of ORS deepening at an intermediate score below 165 or an unfavourable MTS picture.
Typical 12-month total budget for Path B: one to three percent of revenue, which at the benchmark operator is EUR 1.5 million to EUR 4.5 million. The allocation sits at roughly forty percent in A3 (senior-management cost and recruiting), thirty percent in A5 (pipeline qualification and site selection), and thirty percent in governance plus data infrastructure for later buyer DD. Uplift calculation: the differential between mid-Premium and the Platinum border empirically corresponds to two to four multiple points on the typical median bandwidth (12 to 14 times Premium versus 14 to 18 times Platinum, bandwidths from Section 6). Peak deals sit above that — hypergrowth IPO candidates reach post-IPO trailing multiples above 30 times (Dutch Bros, CAVA above 70 times), backtest material in Appendix A. The uplift calculation stays deliberately on the typical median bandwidth, so that the expectation position for the target operator remains robust at the marketing level and no hypergrowth scenarios are implied as the base case. Applied to the benchmark operator — EUR 150 million in revenue times 15 percent EBITDA margin times delta multiple — the enterprise-value increase lands at roughly EUR 50 million to EUR 90 million. The 12-month budget amortises on a successful transition in the magnitude of 15 to 25 times.
Go/no-go for Path B: quarterly score check against the target line of 170 by Q3 as a buffer. If the 170 line is not reached by end of Q3, defer by two quarters or accept an exit in the upper third of the Premium zone. Two consecutive quarters without appreciable score progression below the target line are the signal for path review.
8.3 Path C — Standard to Premium (score 100 to 129 toward 130 to 159)
Starting position: the score sits in the Standard zone with a distance of one to thirty points, or more, to Premium entry. The core risk from Section 6.3 shapes this path: the chain is market-capable, but the buyer dictates the terms, and value corrections between signing and closing are especially frequent in the Standard zone. Path C is the longest upward roadmap and at the same time the typical mid-market starting point for DACH multi-unit operators.
The migration path for Operator XY, unpacked component by component in Section 7.7, is complemented here with investment euros and go/no-go criteria. As a reminder: XY starts with a HERI-40 of 112, the decomposition shows 32 points of ORS distance and 18 points of MTS distance to L'Osteria's Platinum threshold. For Path C, the relevant target line is Premium entry at 130, hence a distance of 18 points. The four quarters below are not a new calculation, but a completion of the 7.7 sketch with execution detail.
Q1 — diagnosis and lever prioritisation (approximately three months). Three parallel work-streams. First, a management-bench audit with an external mandate of EUR 30,000 to EUR 80,000 in advisory fees plus EUR 150,000 to EUR 400,000 of internal opportunity cost. Second, a unit-performance cohort analysis: who sits in the upper quartile of unit EBITDA, who depresses the median, who is structurally unprofitable? Third, a whitespace reality check: how many DACH and EU units are actually viable under the current site format, not wish-driven? The output after Q1 is a gap dossier with three to five prioritised component levers and a target delta of 18 to 25 points across the full twelve months.
Q2 — operational correction sprints (approximately three months). The A2 correction sprint addresses the bottom quartile of the unit distribution. Menu engineering for margin reconstruction, labour-scheduling optimisation, renegotiation of real-estate terms at structural loss-making sites, where necessary closure of non-salvageable units. Typical investment: EUR 500,000 to EUR 2 million, distributed across 12 to 20 units. In parallel, the A1 flow-through lever via cost engineering (cost-of-goods renegotiation with suppliers, labour-productivity initiatives). The majority of the euro spend in Q2 is a one-off restructuring investment that flows into unit-EBITDA dispersion over four to six quarters.
Q3 — build-up of the ORS Premium drivers (approximately three months). Three investments start in parallel. A3 management-bench investment with two to three senior hires, recurring annual comp uplift of EUR 300,000 to EUR 800,000 across all new roles combined. A5 pipeline consolidation with an external site-selection mandate of EUR 50,000 to EUR 150,000 and five to ten qualified expansion sites in the dossier. A4 maturation-curve documentation for historical unit cohort data, EUR 80,000 to EUR 200,000 for the data build — a load-bearing proof point of pipeline amortisation discipline in the later buyer due diligence.
Q4 — MTS window observation and go/no-go (approximately three months). Active watchlist on the four signals from 8.5, in parallel sponsor IR for the B3 signal. Score re-baseline, and on that basis the decision. First path: process start in the next two quarters if the score sits at 128 or above and the MTS signal is trending up. Second path: a further six to twelve months of ORS work at a score between 115 and 127. Third path: acceptance of a Standard-zone exit in the case of stagnation across two quarters.
A realistic score trajectory for Operator XY across the four quarters of the roadmap illustrates the order of magnitude. Starting point HERI-40 of 112 (Q1 entry). Q2 exit after the A2 correction sprint at the bottom-quartile units: plus three to five points, primarily from unit-dispersion compression, interim 115 to 117. Q3 exit after A3 senior hires and A5 pipeline qualification (with ramp-up curve, full effect only in Q4 to Q6): plus four to seven points, interim 119 to 124. Q4 exit after A4 documentation and further A2 maturation: plus three to five points, interim 122 to 129. With a favourable MTS window (two or more watchlist signals green) a further five to eight points of MTS uplift accrue, and the score reaches or crosses Premium entry. The trajectory shows the lever sequence: ORS work first, MTS window as multiplier at the end. It also shows the uncertainty bandwidth: between Q4 exit at 122 (lower bandwidth without MTS contribution) and Q4 exit at 137 (upper bandwidth with MTS tailwind) sit fifteen points, determined purely by execution quality and timing.
Typical 12-month total budget for Path C: two to four percent of revenue, at the benchmark operator EUR 3 million to EUR 6 million. The majority binds into A2 (correction sprints), A3 (management build-up), and A5 (pipeline qualification). Uplift calculation: an 18-point zone migration empirically corresponds to 2.5 to 3 multiple points of differential on the typical median bandwidth (9 to 12 times Standard versus 12 to 14 times Premium, bandwidths from Section 6). Edge cases at the zone boundaries sit above or below that — synergy-adjusted deals in the lower Standard band drop to roughly 7.6 times (Del Taco 2022 as a backtest example), strategic Premium deals with hard bidder competition reach roughly 20 times (Firehouse Subs 2021). The uplift calculation stays conservative on the typical median bandwidth. Applied to the benchmark operator — EUR 150 million in revenue times 15 percent EBITDA margin times delta multiple — the enterprise-value increase lands at roughly EUR 40 million to EUR 70 million. The 12-month budget amortises on a successful transition in the magnitude of 10 to 20 times.
Go/no-go for Path C: quarterly score check against a minimum upward rate of four or more points per quarter from Q2 onward. Two consecutive quarters below that rate are the signal for path review. In that case, three strategic alternatives come into scope: partner sponsor with growth capital, partial exit in the Standard band, or a franchise-model pivot as a structural repositioning instead of continued upward work on the existing model.
8.4 Path D — High-Risk (score below 100): triage, not roadmap
The HERI-40 methodology is not calibrated for high-risk situations. That is an explicit self-limitation, consistent with Section 6.4. The following passage is not a build-up roadmap but a triage guide for three questions that a score below 100 must answer before HERI-40 is the right instrument at all.
First question: thirteen-week liquidity horizon. Is there sufficient cash runway to carry operations through the next three months? If not, the conversation is not an exit conversation but a restructuring conversation with banks, landlords, and key suppliers. The HERI-40 number is in that situation a subordinate diagnostic instrument, not the steering instrument.
Second question: unit dispersion. Is the score composed of an identifiable core of healthy units plus a bleeding periphery? If yes, the option of asset realisation opens up: the healthy core goes to a strategic acquirer or turnaround investor, the loss-making units are closed or wound down in a bad-bank structure. If the weakness is structural and distributed uniformly across all units, the foreground is concept restart, not asset realisation.
Third question: stakeholder alignment. Are sponsors, banks, and main landlords inside a shared restructuring frame, or are they on a collision course? Without alignment, any operational measure in the coming twelve months risks being devalued by a single stakeholder move — a cancelled credit line, a unilateral eviction threat.
Recommended buyer types in distress situations are, as documented in Section 6.4, turnaround private equity sponsors (Quantum Capital, OpCapita, Aurelius), distress specialists, and asset cherry-pickers. For the concrete course of action, turn to restructuring specialists rather than a strategic exit framework. The HERI-40 methodology becomes relevant again in the post-restructuring phase. Once the score has stabilised at 100 to 110 after the sanitisation, Path C applies with a realistic starting point.
8.5 Timing coupling — ORS and MTS in the 12-month window
The isolation scenarios from Section 7.6 show a central operational insight of this paper. The same chain can oscillate between mid-zone and upper band by MTS quarterly shift alone, at constant ORS. The consequence for all three upward paths A, B, and C is a work sequence: lift ORS first to the target level (controllable, twelve to twenty-four months of lead time), then wait deliberately for an MTS window, bring both together at the deal date.
The watchlist operationalises the MTS window in four signals with concrete thresholds. First, the ICE BofA US High Yield Option-Adjusted Spread: two consecutive months below 400 basis points is the B4 upward signal, because the capital-markets window opens and LBO financing becomes available again on competitive terms. Second, the IPO volume trend in the hospitality segment: three consecutive quarters of upward movement — data base and methodology in Section 5.4 — is the B2 dealflow signal. Third, the PE dry-powder indicator: hospitality allocations in sector fund-newsletter reports (methodology in Section 5.4.3) are an early indicator of active buyer budgets in the coming quarter. Fourth, the hospitality M&A transaction count as a rolling four-quarter index against the baseline of 2021 and 2024.
The coupling logic for Path B and Path C reads: quarterly check in Q4 with the ORS score at target level plus at least two of four MTS signals green equals process start preparation in the next two quarters. Counter-indication: a process start against an MTS trough — for instance high-yield spreads above 600 basis points and falling IPO volume — costs two to four multiple points independent of the ORS score, by backtest empirics. A deferral of two to four quarters is in that case frequently the path with the higher expected value, even if it is uncomfortable for the founder-entrepreneur.
The asymmetry between ORS and MTS has a second operational consequence. ORS levers work in both directions: the operator who builds senior management, runs unit sanitation, and qualifies pipeline improves the score durably. MTS levers are a one-off quarterly chance at the deal date. Whoever misses the window may have to compensate for ORS erosion from competition, cost inflation, or key-management departures by the next cycle. The roadmap arithmetic rewards decisive process triggering in the right window, not perfect optimisation deep into the next cycle.
A third consequence concerns the quarterly granularity of watchlist stewardship. The four signals are to be checked not once per quarter but monthly, because the B4 component (capital-markets window) oscillates along high-yield-spread movements on a weekly basis. An experienced CFO or corporate-development lead takes this on as a running line, not as a project. The operational routine is monthly signal snapshots with quarterly aggregation in the steering committee, deal-trigger decision at the board rhythm.
8.6 Decision framework — path choice at a glance
The framework for path choice has two dimensions. The primary dimension is the score band from Section 6, the secondary dimension is the trend direction of the last four quarters: rising, stable, or falling. Out of the combination, six typical constellations result, each with a recommended path.
Score 165 rising equals Path A defensive, process preparation in six to nine months. Score 160 falling equals Path A urgent, priority on A3 stabilisation and A2 dispersion control, process to be pulled forward where possible ahead of further slippage. Score 150 rising equals Path B regular, fourteen to eighteen months to the Platinum border is realistic. Score 135 falling equals Path B defensive-corrected: stabilisation first inside the Premium band, then consider the climb. Score 115 rising equals Path C regular, twelve to eighteen months to Premium entry. Score 105 stable or falling equals Path C review with the core question whether ORS levers suffice or whether a strategic repositioning is required.
The matrix does not replace an advisor or a DD team. It performs a different task: it sorts the current score position into an action grid before the operator enters process build-up. A score of 135 falling is a different picture from a score of 135 rising, even if both figures sit on the same matrix row. The trend direction is the second load-bearing piece of information and becomes decisive in the choice between regular and defensive path.
8.7 Transition to Appendix A
The methodological side of this paper is now complete. The reader has understood ORS (Section 4), understood MTS (Section 5), applied the zone reading (Section 6), followed the calculation through the worked example of L'Osteria step by step (Section 7), and received a 12-month roadmap sketch per zone (Section 8). What follows is the evidence.
Appendix A supplies the empirical proof that the thresholds 100, 130, and 160 hold. Ten deals from the period 2018 to 2025, component-wise reconstructed scores, multiple reconciliation, and zone consistency check sit there in tabular form together. Appendix B documents the data base transparently — with three open gaps, not as a weakness but as a methodological obligation. Appendix C, where released, shows an anonymised client case through the roadmap lens and demonstrates in a real case how path choice looks in execution.
Related research
- The roll-up playbook in European hospitality: where multiple arbitrage still works
- Parent-company DNA as a valuation variable: KFC Germany and Taco Bell's USD 60 million miss
- Multiple compression in mid-market foodservice: reading the 2024–2025 corridor
- HERI-40 Section 1: Executive Summary
- HERI-40 Section 2: Market Context 2026
- HERI-40 Section 7: Worked example — L'Osteria