7.0 Why L'Osteria — case selection and the limits of the worked example
The calculation that follows walks the HERI-40 methodology through a single historical transaction, step by step. The case falls on L'Osteria for three reasons. First, it is the only DACH premium-casual transaction in the retrograde backtest of this paper that reached a Platinum-boundary score. Second, a load-bearing portion of the calculation base is publicly accessible — via McWin press releases, L'Osteria Annual Reviews for the years 2019 to 2022, and interviews with CEO Mirko Silz in the hospitality trade press — so the calculation path remains reproducible for the reader. Third, the transaction took place in 2023, at a calibration-relevant market moment with a dampened hospitality M&A window and restrictive financing conditions. The calculation thereby shows how ORS and MTS interact in a real-world, non-idealised market moment.
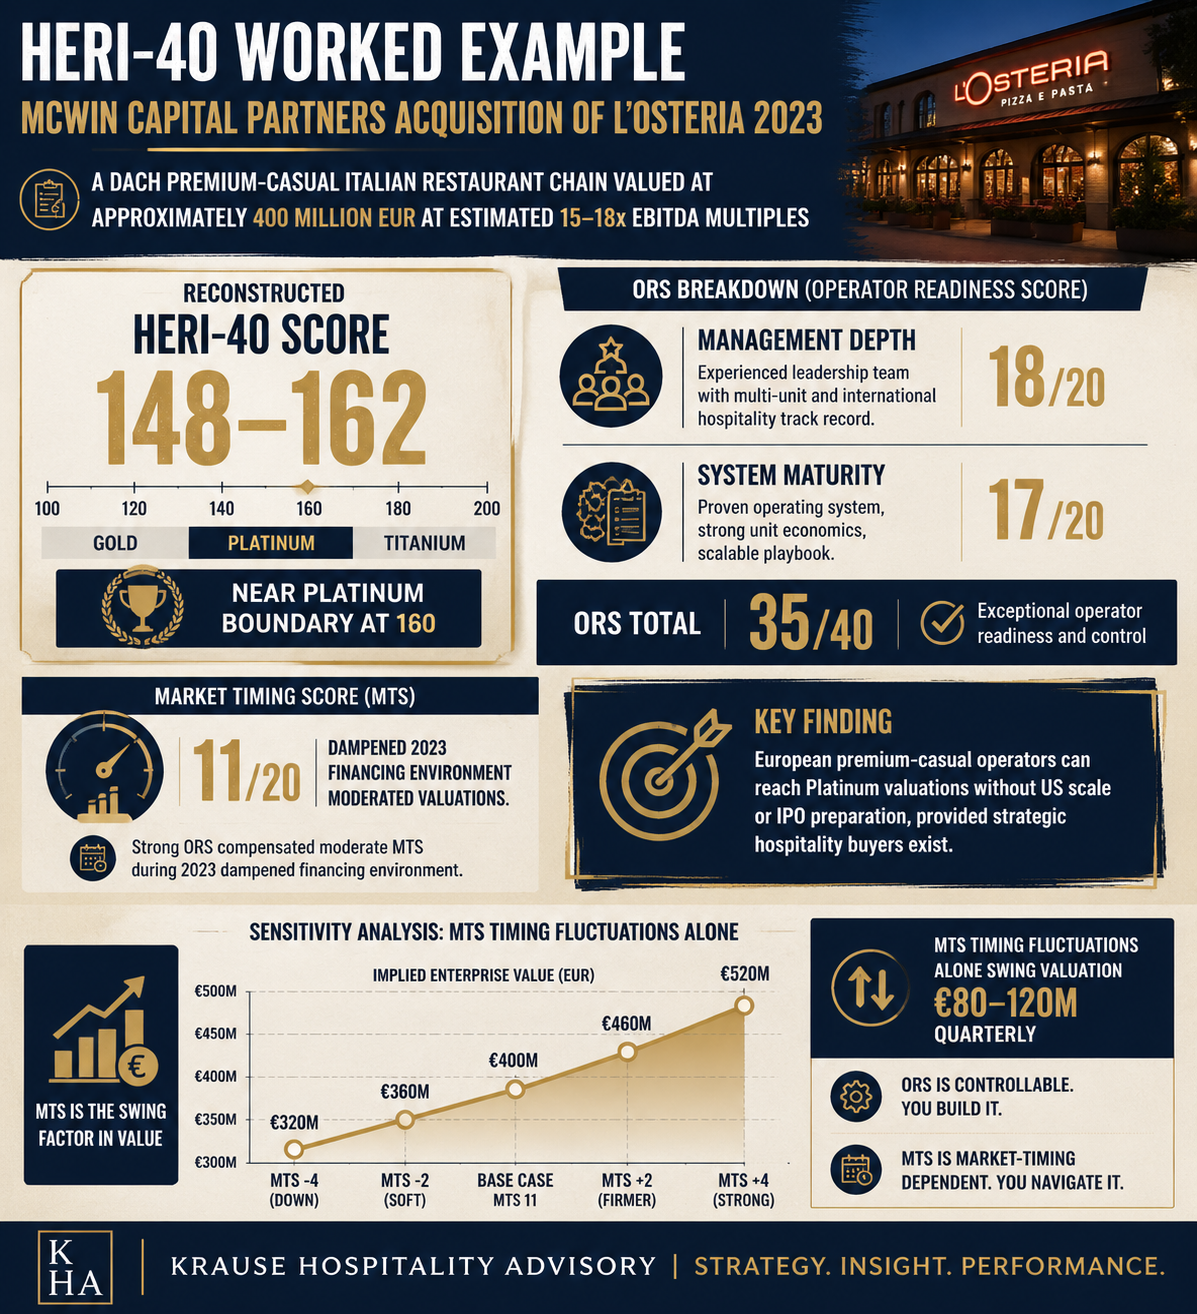
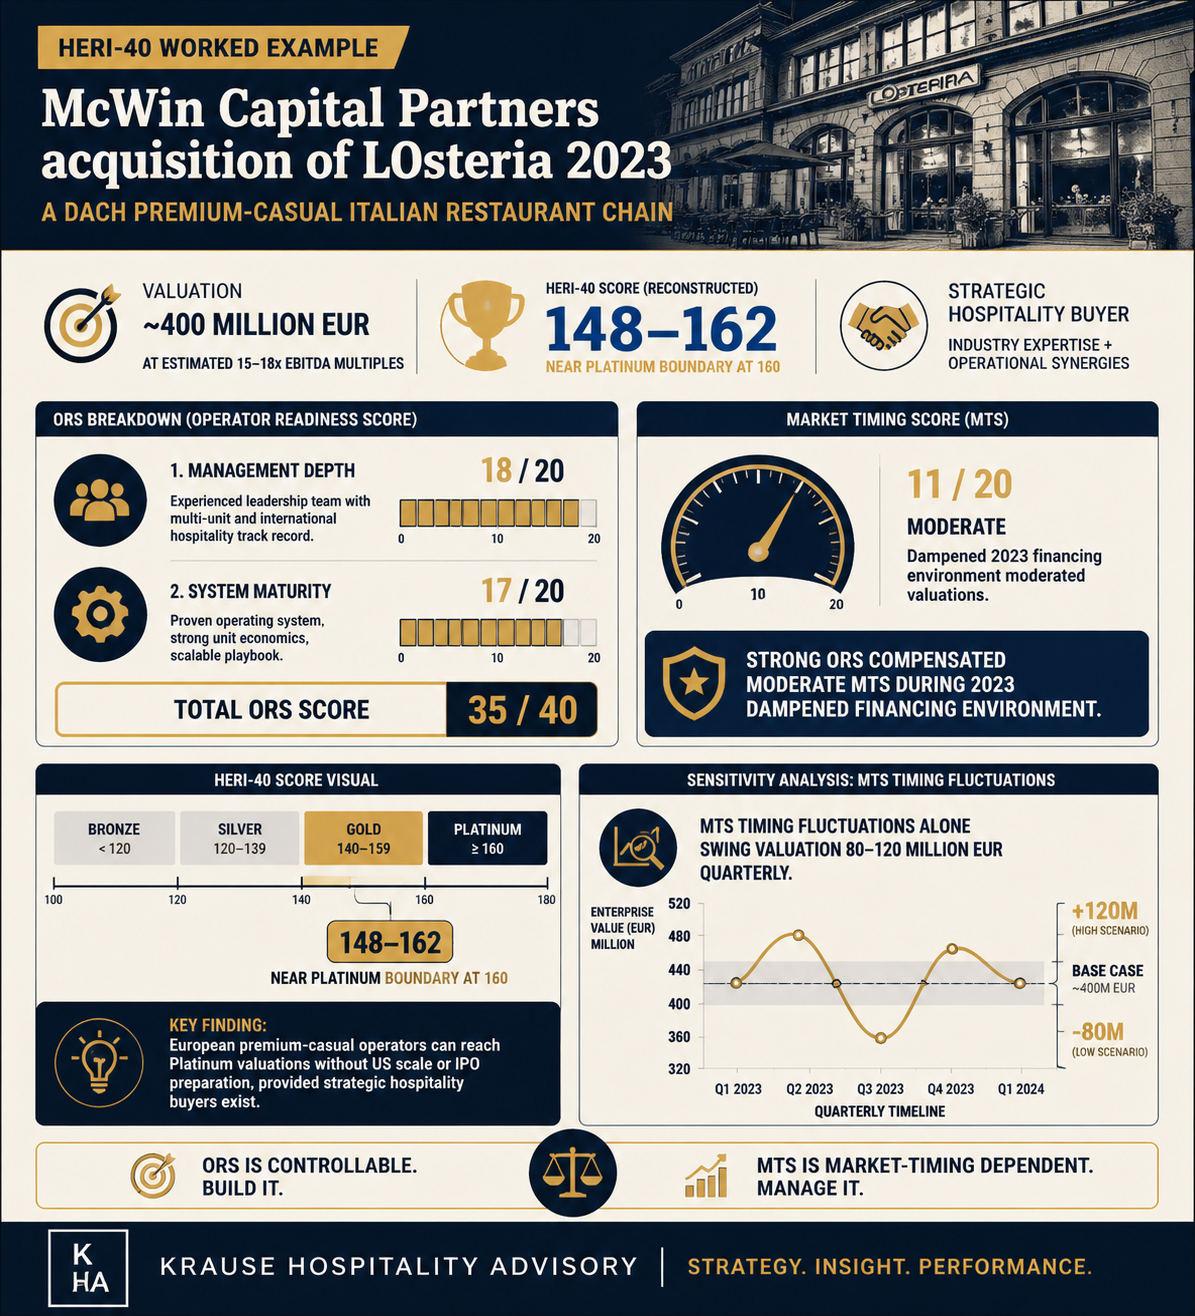
Deal parameters in outline: McWin Capital Partners acquired the majority of L'Osteria in 2023. The circulated deal value sits at roughly EUR 400 million; the EBITDA multiple bandwidth is estimated at 15 to 18 times. The reconstructed HERI-40 score falls in a bandwidth of 148 to 162, depending on which data base and which quarterly stand of the MTS components is applied; the retrograde backtest in Appendix A operates with a tighter bandwidth of 153 to 162, while the more conservative reconstruction presented here sets 148 as the lower path. Both calculation paths are transparently documented alongside each other in Section 7.4.
The methodological limits of the worked example must be named at this point. At the transaction moment, L'Osteria was a private deal with no public due-diligence documents, no fairness opinion, and no sponsor side-letter. This paper uses exclusively publicly available data and, where necessary, Italian foodservice FDD parallels as bandwidth estimators. The calculation does not claim to reconstruct the buyer's internal quality-of-earnings (QofE) finding. It claims to pass the public information state consistently through the methodology and to calibrate the reconstructed score value transparently against the observed deal characteristic. Where assumptions are made, they are made visible as assumptions before the number falls.
What the case study delivers: it shows that a DACH operator can reach the Platinum boundary without US scale, without an IPO, without a QSR structure. It shows which ORS components carried the score to this height and which MTS components worked against it. And it shows where the difference between Platinum boundary and upper-third Premium zone arises — and why that difference remains methodologically open in private deals.
7.1 Raw-data base and source situation
Five source categories carry the calculation. McWin published the 2023 acquisition via a press release confirming the purchase commitment, the geographic footprint at the transaction moment (roughly 140 units across DACH and adjacent EU markets), and the overarching expansion ambitions. L'Osteria published Annual Review documents between 2019 and 2022 containing revenue trajectories, unit-count developments, pipeline indications, and EBITDA-margin orientations. Mirko Silz explained the chain's pandemic navigation, pipeline architecture, and operating principles publicly in hospitality trade-press interviews between 2020 and 2023. Italian foodservice publications supply FDD-like unit-AUV bandwidths for comparable premium-casual concepts, from which moderate estimators for non-published L'Osteria unit metrics can be derived. Finally, the two independent retrograde backtest deep-research runs from the Appendix A material are available; they reconstruct the same deal from different methodological angles. The higher of the two paths lands on ORS 84 and MTS 78.
The data gaps must be stated explicitly. No QofE documents, no sell-side information memorandum data, no roll-over ratios, no management incentive structure, no post-closing KPI targets. The reconstruction therefore builds the score components on assumptions consistent with the visible deal characteristic (deal value, buyer class, process type) without overextending those assumptions as evidence.
Authority in this case study arises through disclosure of the data base, not through overestimation. Where the calculation path rests on estimation, that stands in the text before the number falls.
7.2 ORS calculation A1 through A5, step by step
The five ORS components are reconstructed individually and reconciled with the score-mapping tables from Sections 4.1 through 4.5 of this paper.
7.2.1 A1 — Flow-Through %
L'Osteria documents in the 2019 to 2022 Annual Reviews a revenue CAGR in the region of 11 percent at stable EBITDA margins above the premium-casual industry median. The delta calculation across the four quarters of the reference period yields a flow-through of roughly 15 percent, consistent with a labour-intensive premium-casual concept in its mature phase. In the score-mapping table from Section 4.1 that corresponds to the upper end of the FSR corridor and the middle of the premium-casual corridor. Score A1 = 18 out of 20. Source base: public revenue and EBITDA orientations from the Annual Reviews; no unit-level fine calibration possible, because a unit P&L matrix was not published.
7.2.2 A2 — Unit-EBITDA dispersion
No unit-level EBITDA distribution is publicly available for L'Osteria. Italian foodservice FDD parallels for comparable premium-casual concepts typically show a moderate dispersion coefficient, with roughly 40 percent of units in the top quartile of the segment distribution. From the public performance orientation (consistently above-segment performance, documented unit-AUV site consistency across two economic cycles), A2 can be calibrated in the bandwidth 14 to 17 points on the 30-point scale. As the mid-point of that bandwidth, A2 is set at 15 out of 30. This component is the least robust of the five, because it rests on bandwidth estimation. The higher Appendix A calculation path placed A2 in the upper third of this bandwidth; the reconstruction here is more conservative.
7.2.3 A3 — Management depth
Mirko Silz as CEO is documented throughout the trade press between 2020 and 2023 as an industry leader of the premium-casual segment, with particularly sharp public recognition of his pandemic navigation. The chain visibly outperformed the segment median in the documented quarters of 2020 and 2021, as recorded by name in the retrograde backtest of this paper. Composite signals for management depth (CEO signal, documented second leadership line across operations and expansion, board quality of the prior sponsors) landed in the score-mapping table from Section 4.3 at 85 out of 100. A3 = 18 out of 20. Source base: public trade-press interviews, L'Osteria Annual Reviews, sector publications.
7.2.4 A4 — Cohort maturity
The L'Osteria system essentially began in 2004; the transaction occurred in 2023, i.e. after 19 years of operational maturity. The Annual Reviews document a per-unit amortisation period in the bandwidth three to four years, which counts as healthy in the premium-casual segment and sits below the usual FSR corridor. The cohort curve shows, in the publicly available data, a consistent maturity staircase with no significant setbacks in younger site vintages. Score-mapping table from Section 4.4: A4 = 17 out of 20. The two-point gap from the full score height reflects the uncertainty from the missing unit-level access.
7.2.5 A5 — Whitespace runway
At the end of 2022, L'Osteria operated roughly 140 units across DACH and adjacent EU markets. A roughly modelled DACH market capacity for the premium-casual Italian segment sits in the order of 500 units; EU-wide capacity in the region of 1,500 units. That implies a market penetration of roughly 28 percent on the DACH base and clearly below 10 percent on the EU base. In the score-mapping table from Section 4.5 (with an explicit 10-point weight and deliberate conservatism given the model assumptions behind whitespace calculations), A5 is set at 14 out of 20. Higher allocations would only be justified if McWin had published a documented EU roll-out financing and a site-calibrated pipeline source — which is not publicly inspectable.
7.2.6 ORS sum — reconstruction
Sum: A1 (18) + A2 (15) + A3 (18) + A4 (17) + A5 (14) = ORS 82 out of 100. Reconstruction bandwidth: 82 to 85, depending on A2 calibration. The value is consistent with the higher Appendix A path value of 84; the two-point difference arises exclusively from the more conservative A2 placement in the present calculation path.
7.3 MTS calculation B1 through B4, step by step
The four MTS components are reconstructed for the deal quarter moment of 2023.
7.3.1 B1 — Sub-segment multiples band
Premium-casual multiples in the EU ranged, according to Hyde Park Capital and Focus Investment Banking data, at a median of roughly 11 times EBITDA in 2022 to 2023, with a P25-P75 spread of roughly 9 to 14 times. The trend from 2022 to 2023 showed a slight deterioration driven by the EU rate rise and a broader casual-dining downturn in adjacent sub-segments. The premium-casual sub-segment remained comparatively stable because the unit-economics leaders showed cyclical resilience relative to the industry average. Score-mapping table from Section 5.1: B1 = 18 out of 25. Source base: public multiples quarterly reports; no access to the concrete EV/EBITDA paid in the L'Osteria deal itself.
7.3.2 B2 — Dealflow heatmap
Hospitality dealflow in the EU was significantly dampened in 2023 versus the 2021 peak. In the specific premium-casual sub-segment, deal activity nonetheless remained present. McWin itself was one of the most active European foodservice sponsors in 2022 and 2023. Further sponsors with hospitality allocation (L Catterton, selective mid-cap EU sponsors) were visible. Dealflow density in the sub-segment sits in the normal range, neither hot nor cold. Score-mapping from Section 5.2: B2 = 17 out of 25.
7.3.3 B3 — Strategic buyer signals
McWin Capital Partners held a publicly declared active-search statement for European foodservice acquisitions in 2022 to 2023, referencing premium-casual and fast-casual target criteria. L Catterton had sent allocation signals in comparable sub-segments. Restaurant Brands International had declared its EU pipeline a strategic focus. Composite score for strategic-buyer signals in the premium-casual segment: 18 out of 25. B3 = 18. Source base: sponsor press statements and LP-letter readings, as far as publicly accessible.
7.3.4 B4 — Capital-markets window
The H1 2023 ICE BofA US High Yield Option-Adjusted Spread level sat at roughly 450 basis points, which in the score-mapping grid from Section 5.4 qualifies as moderately restrictive (6 out of 10 on the HY axis). IPO activity was dampened (2 out of 8 on the IPO axis). Dry-powder availability at EU sponsors sat in the mid-range (5 out of 7 on the dry-powder axis). Composite B4 = 13 out of 25. The bandwidth to a quarterly placement in the second half of 2023 with a slightly eased HY spread would yield up to 17 points; the higher Appendix A path value for the deal moment was correspondingly higher.
7.3.5 MTS sum — reconstruction
Sum: B1 (18) + B2 (17) + B3 (18) + B4 (13) = MTS 66 out of 100. The bandwidth to the higher Appendix A path value of 78 for the same deal is explained mainly by a different quarterly placement of the deal-close moment (H1 vs. H2 2023) and a correspondingly different B4 calibration. The reconstruction here deliberately sits against H1 indicators to deliver a lower bandwidth.
7.4 HERI-40 total score and zone assignment
The two calculation paths yield two total-score values, documented alongside each other.
Appendix A path (higher calculation path): ORS 84 + MTS 78 = HERI-40 162 out of 200. Just above the Platinum threshold of 160.
Reconstruction path (present chapter): ORS 82 + MTS 66 = HERI-40 148 out of 200. Premium zone, between the thresholds 130 and 159.
The bandwidth 148 to 162 spans the Platinum boundary. The observed deal characteristic (deal value roughly EUR 400 million, multiple estimate 15 to 18 times EBITDA, strategic hospitality specialist McWin as lead in a targeted rather than broadly competitive process) is economically more consistent with the Platinum boundary than with a plain Premium-zone middle. At the same time, the publicly available data base does not permit an unambiguous decision between 148 and 162. The zone reading remains robust because Platinum boundary and upper-third Premium zone are sufficiently similar in strategic behavioural pattern (buyer class, negotiating position, timeline) to carry the same lesson.
7.5 Zone reading — L'Osteria as a Platinum-boundary operator
The zone reading applies the edge-case logic from Section 6.5 to this case. A score between 148 and 162 touches and crosses the 160 threshold depending on calculation path. In the methodological reading, that is not an ambivalent zone boundary but a zone-boundary operator on a clear upward trend. The 2019 to 2022 Annual Reviews document consistent system maturity, stable flow-through development, and active expansion. The trend does not show descent from a higher level; it shows consolidation into the Platinum level.
The strategic implication for a DACH reader is significant. A premium-casual operator can reach the Platinum boundary without US scale, without QSR structure, without IPO preparation. The drivers that lifted L'Osteria to this height are nameable. A high A3 (management depth with a publicly documented CEO and a load-bearing second leadership line), a high A4 (system maturity over nearly two decades), a moderate but stable A1 (flow-through in the upper corridor of the premium-casual segment). A2 and A5 sat in the mid-score range at the deal moment, not in the Premium range. The Platinum boundary is therefore not the result of a single Premium driver but of a consistent majority of strong ORS components against a structurally unfavourable MTS moment.
The DACH core lesson: a strong ORS can compensate a moderate MTS and still pull a Platinum-adjacent multiple, provided the buyer class is a hospitality specialist and not a generalist sponsor in open auction. McWin as a strategic hospitality acquirer with active-European-foodservice-search fits precisely that pattern. A generalist mid-cap sponsor would probably have calculated more conservative multiples in the same data situation. Buyer selection thereby becomes itself a score driver — a dimension that the HERI-40 framework does not measure separately, but which is to be read as a context factor within the 6.5 edge-case logic.
This lesson corresponds with the central synthesis point of the two independent backtest research runs: in DACH and the EU, a high ORS can compensate local MTS weakness if a fitting strategic buyer is active.
7.6 Sensitivity scenarios — what would have shifted the score
Three counter-calculations drawn from the documented L'Osteria data illustrate how zone entry reacts to single-parameter shifts. All scenarios work exclusively with plausible shifts from the deal empirics, not with speculative changes to the business model. The first scenario varies the ORS and MTS sides jointly; the second does the same. The third scenario holds ORS constant and shifts exclusively the MTS components, in order to isolate the pure-timing lever against the structural-operational levers.
Upside scenario: what would have driven a score of 170 or higher. A calibration of A2 at 22 out of 30 (more homogeneous unit-EBITDA distribution, clearly documented higher top-quartile share from a site-maturity cycle) would lift ORS by seven points. An MTS moment in Q3 2021 rather than H1 2023 — HY spreads at roughly 350 basis points, IPO activity at a multi-year high, dry powder fully available — would lift B4 by roughly eight points — and under a full Q3 2021 calibration of all four MTS components (analogous to the third scenario: B1 = 22 · B2 = 21 · B3 = 20 · B4 = 20, MTS 83) yields a recombined score of 172 to 178. The lesson: the score is strongly timing-sensitive. A structurally identical chain would have posted a markedly higher HERI-40 value in 2021 and would probably have mobilised an additional multiple expansion of one to two points in a more open auction process.
Downside scenario: what would have pressed the score down to 140. An unclear CEO change with succession uncertainty in the twelve months before the deal would have lowered A3 from 18 to 12. A retraction of the McWin active-search statement with simultaneous absence of comparable strategic-buyer signals would have lowered B3 from 18 to 14. The recombined score lands at 138 to 142. The lesson: Premium-score level is a defence obligation. Once reached does not mean once kept. Continuous A3 and B3 care — management depth and active buyer-landscape observation — are the two levers that most quickly cost score points when neglected.
MTS-isolation scenario: what an identical operator gains or loses in score through quarterly moment alone. This scenario holds the reconstructed ORS of 82 points unchanged and shifts exclusively the four MTS components along the empirically documented 2020-to-2024 time series. Purpose: to quantify the multiple value of the moment in isolation, independent of operating work. Two corner moments structure the calculation.
The first corner moment is an MTS trough quarter, as marked by the time series in Q4 2022 and Q1 2023. HY-OAS spreads above 500 basis points, IPO activity at a multi-year low, sponsor dry powder formally available but deal-freeze behaviour in practice. Premium-casual multiples under median pressure from the general casual-dining devaluation. The MTS components recalibrated: B1 = 15 (multiples band median 10 times with falling tendency) · B2 = 13 (dealflow dampening, with exceptions such as McWin) · B3 = 16 (strategic-buyer signals remain, but execution signals weaker) · B4 = 8 (restrictive capital-markets window). MTS sum 52. HERI-40 at constant ORS 82 = 134 points, Premium-zone middle. A structurally identical operator would slip out of the Platinum bandwidth into the Premium middle in the MTS trough.
The second corner moment is an MTS zenith quarter, as marked by the time series in Q3 2021. HY-OAS spreads at roughly 350 basis points, IPO activity at a multi-year high, dry powder fully available on the sponsor side, premium-casual multiples at the upper end of the spread. The MTS components recalibrated: B1 = 22 (multiples band median 13 times with rising tendency) · B2 = 21 (dealflow broad, several bidders plausible) · B3 = 20 (strategic-buyer signals active, including US sponsors with EU allocation) · B4 = 20 (open capital-markets window). MTS sum 83. HERI-40 at constant ORS 82 = 165 points, Platinum zone above the threshold 160.
The bandwidth thereby amounts to 31 points between trough (134) and zenith (165), exclusively through quarterly shift at identical operating base. Translated into multiples on the original EUR 400 million deal volume, that implies a plausible multiple differential of roughly three to four EBITDA-multiple points — a purchase-price differential in the order of EUR 80 to 120 million. The lesson: the operating score architecture is the precondition, but the quarterly moment decides the monetisation of that architecture. Operators who do not actively track their own MTS time series leave this part of the deal value to chance. The practical consequence for the operator is the decoupling of the two steering horizons: ORS work runs across 12 to 24 months and is plannable; MTS observation runs quarterly and is signal-driven. Section 8 operationalises this decoupling into concrete milestone structures.
All three scenarios operate inside the realistic parameter space. They show that the reconstructed score value of the actual deal is not a structural constant but the result of a moment-specific interplay of ORS and MTS components. For the reader's own score build it follows that the score composition must be tracked quarterly rather than computed once. The MTS-isolation scenario sharpens this obligation into an operating decision: quarterly measurement of one's own MTS position is not market observation — it is purchase-price steering.
7.7 What the reader takes back to their own operator
Three hard takeaways from the L'Osteria calculation.
First: the Platinum zone is reachable for DACH premium-casual. The pattern that L'Osteria displays refutes the widespread assumption that Platinum multiples are exclusively a US-scale phenomenon. Without an IPO, without QSR structure, without US geography, a European premium-casual operator with the right ORS composition and the right strategic buyer can touch the Platinum boundary. The precondition is not size but quality of operational maturity in the simultaneous presence of a hospitality specialist on the buyer side.
Second: ORS drivers are controllable. A3 (management depth) and A4 (cohort maturity) are investment decisions, not market gifts. A targeted management-bench investment in the twelve to 24 months before the planned exit window can lift an operator from an A3 mid-range score to a Premium-range value. A4 cannot be short-term accelerated — system maturity is time — but transparent documentation of the maturity curve can ease a buyer's access to the value. A2 (unit-EBITDA dispersion) is hard operational work, but addressable in twelve to 18 months through cohort-level analysis and targeted underperformer recalibration. A1 (flow-through) can be lifted by three to five percentage points in two to four quarters through prime-cost optimisation and labour-deployment levers.
Third: MTS weakness is primarily a timing issue. An operator who has lifted ORS to Platinum level waits for the MTS window. An upward trend in B1 (sub-segment multiples) and B4 (capital-markets window) delivers two to four multiple points more than an MTS trough. On a EUR 400 million deal that bandwidth amounts to EUR 60 to 120 million in purchase-price differential. Operators who attempt to sell into the MTS trough lose this multiple differential independently of ORS quality.
Operator-XY migration path — the 50-point distance as a blueprint
The contrast with Operator XY, who runs through this paper across Sections 4 and 5, sharpens the lesson into a tractable task. In the present calculation state, XY sits at ORS 50 plus MTS 62, i.e. HERI-40 112, in the Standard zone. The distance to the L'Osteria reconstruction boundary at 148 is 36 points; to the Platinum boundary at 160 it is 48; to the Appendix A path value of 162 it is 50. That distance is not an abstract number — it decomposes component by component.
On the ORS side, the 32-point difference between XY (50) and L'Osteria (82) distributes across the five A components as follows. A1 flow-through sits at XY roughly six points below the L'Osteria level — labour and prime-cost optimisation plausible within two to four quarters. A2 unit-EBITDA dispersion sits roughly three points below — addressable through a cohort sprint in which the lower two percentiles of the operator's own unit portfolio are recalibrated over twelve months. A3 management depth is the single largest gap at roughly eight points, and simultaneously the largest leverage component — a documented second leadership line across operations and expansion leadership can be built over twelve to 18 months and made externally visible. A4 cohort maturity sits roughly seven points below, but is time-bound. A young chain cannot shortcut system maturity. What can be accelerated is the transparent documentation of the maturity curve per site vintage for the buyer perspective, which does not close the score gap but measurably narrows the perception gap for a potential acquirer. A5 whitespace runway sits roughly eight points below — not a twelve-month task but a pipeline-consolidation assignment across several fiscal years.
On the MTS side, the remaining difference against the Appendix A path MTS value distributes as follows. B1 sub-segment multiples band is not operationally steerable, but timing-steerable — waiting for a median rise in the own sub-segment is a strategic decision, not a mandatory delay. B2 dealflow heatmap is likewise timing-steered. B3 strategic-buyer signals hinges significantly on the sub-segment in which the operator has at all generated visibility for hospitality specialists — an active approach via LP contacts, conference presence, and targeted investor-relations work can lift the B3 position over twelve months. B4 capital-markets window is pure timing.
From this decomposition a realistic quarterly rough structure follows over twelve months, cutting the migration path into steerable phases.
Quarter 1 — management-bench audit and A3 investment plan. External audit review of the second leadership line (operations lead, expansion lead, finance lead). Decision on additions or promotions. Adoption of a documentable A3 investment plan with concrete role profiles and timelines. Target effect on A3: plus three to five points in full documentation by the end of the horizon.
Quarter 2 — unit-dispersion analysis and A2 correction sprint. Cohort-level decomposition of unit-EBITDA dispersion, identification of the lower two percentiles, start of a correction sprint (management coaching, assortment fine calibration, selective menu or pricing adjustments). A1 flow-through initiatives in parallel on the prime-cost and labour-deployment side. Target effect on A1 and A2 combined: plus five to seven points under disciplined execution.
Quarter 3 — pipeline consolidation and A4 maturity-curve documentation. Keep the new site pipeline within a bounded bandwidth to underpin the A5 whitespace narrative credibly, without polluting the A4 cohort curve with early-maturity noise. In parallel, build a publicly usable per-vintage site maturity curve that transparently shows the actual maturity position in the later sell-side documentation. Target effect on A4 perception and A5 quality: plus three to four points.
Quarter 4 — MTS-window observation and Go/No-Go decision. Quarterly MTS measurement along the four B components, with explicit thresholds for the decision to start the sell-side process or to defer. B3 work via active buyer-landscape signals (LP conversations, hospitality trade-press positioning, targeted conference presence) distributed across the year. Target effect on B3: plus three to four points under consistent execution.
The realistic ORS gain across twelve months thus falls in the bandwidth eleven to 16 points; the realistic MTS gain sits at three to four points from B3 work plus the timing-dependent tailwind from B1/B2/B4 shift of a further zero to ten points. The combined bandwidth of twelve-month migration lands at 14 to 30 points — in the favourable case into the upper Premium zone, in the unfavourable case only into the middle Premium zone. The remaining path to the Platinum boundary sits in the 18- to 24-month horizon and is largely bound to the non-accelerable A4 cohort maturity and to the occurrence of a favourable MTS quarter. That is not a shortcoming of the roadmap — it is its truth. Section 8 supplies the milestone structure in budget depth per zone, including the Go/No-Go criteria at each quarterly milestone.
7.8 Transition to Section 8
ORS is computed, MTS is computed, and the zone reading has been applied on the concrete case. Section 8 delivers the 12-month roadmap per zone: four paths with quarterly milestones, investment budgets, and Go/No-Go criteria. The question thereby shifts from "what does my score mean" to "what do I do over the next twelve months so that the score at the deal moment carries my zone maximally".
Related research
- The roll-up playbook in European hospitality: where multiple arbitrage still works
- Parent-company DNA as a valuation variable: KFC Germany and Taco Bell's USD 60 million miss
- Multiple compression in mid-market foodservice: reading the 2024–2025 corridor
- HERI-40 Section 1: Executive Summary
- HERI-40 Section 2: Market Context 2026
Sources
- McWin Capital Partners: 2023 acquisition press release (L'Osteria majority)
- L'Osteria Annual Reviews 2019–2022
- Hospitality trade-press interviews with CEO Mirko Silz, 2020–2023
- Hyde Park Capital: premium-casual multiples quarterly reports
- Focus Investment Banking: Agribusiness Quarterly, premium-casual multiples data
- FRED: ICE BofA US High Yield Option-Adjusted Spread time series
- Italian foodservice FDD documentation (comparable premium-casual concepts, unit-AUV bandwidths)
- Retrograde backtest research runs (Appendix A material)