5.0 What the MTS delivers, and why the weighting is symmetric
The Market Timing Score measures how favourable the external M&A window is for your exit at this moment. The dimension is complementary to the ORS dimension from Section 4: ORS measures what you can control. MTS measures what you cannot control but still have to read correctly. A chain with perfectly prepared selling readiness meeting a collapsed buyer market either sells below value or does not sell at all. Vapiano 2019–2020 is the documented example: a chain with eroding ORS readings met an additionally collapsing MTS during the casual-dining crisis, and the combination led to insolvency.
Four components, not three and not five. Each sub-component addresses a separate buyer question that every sponsor answers internally before a Letter of Intent. Which multiples are buyers paying in your sub-segment today? B1 answers that. How many deals are being closed in your segment at all? That is B2. Which buyers are active and in acquisition mood? That is B3. Can those buyers finance the deal the purchase price demands? That is B4. Four questions, four answers, one number.
The weighting is symmetric: B1 = B2 = B3 = B4 = 25 points. That symmetry is not a compromise; it is methodological prudence. Unlike the ORS dimension, where the retrograde backtest identified A2 (unit-level EBITDA dispersion) as a clearly superior single indicator and justified the asymmetric weighting A2 = 30, the same backtest did not reveal comparable asymmetry across the four MTS components. All four B-signals showed comparable predictive strength in the documented Premium and Distress cases. In the v1.1 recalibration (scheduled in 12 months) MTS weighting will be reassessed against an expanded deal sample. Until then the symmetric allocation stands.
In the next four subsections we decompose B1 through B4 in order. Each subsection contains formula, tracking workflow, bandwidth, data sourcing, and a score-mapping table. The example Operator XY from Section 4 (Premium-Casual DACH, 47 sites, ORS 50) continues the self-diagnostic here. In 5.5 we sum the four sub-scores into the MTS and add it to the ORS to see a complete HERI-40 total score for the first time.
5.1 B1 — Sub-segment multiples band (weight 25 points)
5.1.1 What the multiples band measures
B1 is the most direct market-price signal in the entire HERI-40 methodology. You are not measuring a proxy; you are measuring the actual EV/EBITDA price buyers pay in your sub-segment today. Segment-specific, not aggregated: QSR multiples can rise in a quarter while Casual multiples fall. A Premium-Casual operator who tracks the aggregated "hospitality multiple trend" measures a blended number that does not describe their market.
The trend dimension matters more than the point-in-time snapshot. Buyers buy the trend, not the point price. A chain sold in 2023 at a median 8× and one sold in 2026 at a median 10× meet different buyer sentiments — not only different prices. The trend is the signal.
5.1.2 Data sources and a hybrid strategy
The clean data base for B1 runs over four publicly accessible sources anchored in the paper's Pre-Pub six-source hierarchy. Hyde Park Capital publishes quarterly reports on hospitality multiples with sub-segment granularity. Focus Investment Banking delivers Agribusiness and Foodservice quarterlies with P25/P75 bands. SEC EDGAR holds DEF-14A fairness opinions (frequently produced by Piper Sandler) containing comp-set tables from which sub-segment percentiles can be reconstructed. The Restaurant Finance Monitor 200 rounds out the US-focused view with unit-level deal data.
Workflow for the rolling score: evaluate new fairness opinions monthly, extract peer-group multiples, roll quarterly median values per sub-segment forward. Residual overhead is 15 to 20 hours per month. That time is the price of avoiding a PitchBook or Mergermarket subscription in the launch budget, each of which costs more than EUR 25,000 per year. The hybrid strategy is a deliberate choice and is validated for the first six months after launch. A reassessment of the PitchBook upgrade is scheduled after six months or after ten reports sold.
5.1.3 Bandwidth and examples 2024 to 2026
The specific 2024 median values that orient your own score build come from the consolidated data base of Hyde Park, Focus IB, and publicly accessible SEC fairness opinions:
- Restaurants overall: median EV/EBITDA 17.3×
- Foodservice: median 12.3×
- Baked Goods: median 9.1×
- Beverages: median 11.6×
- Lower-middle-market hospitality overall: median 6.1×
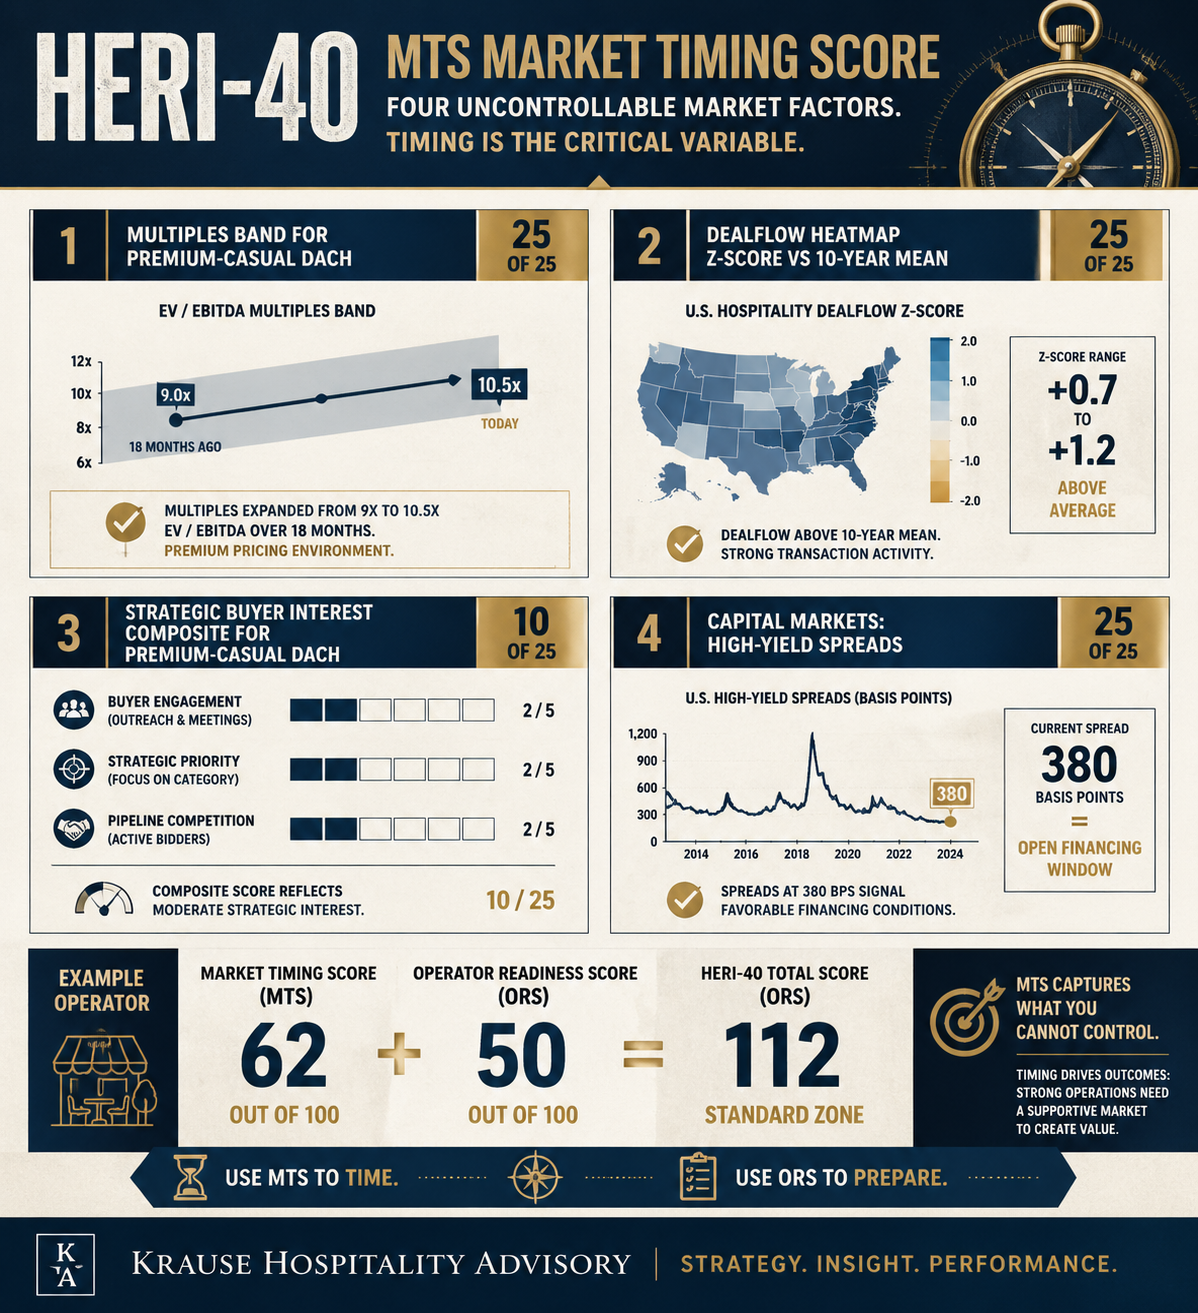
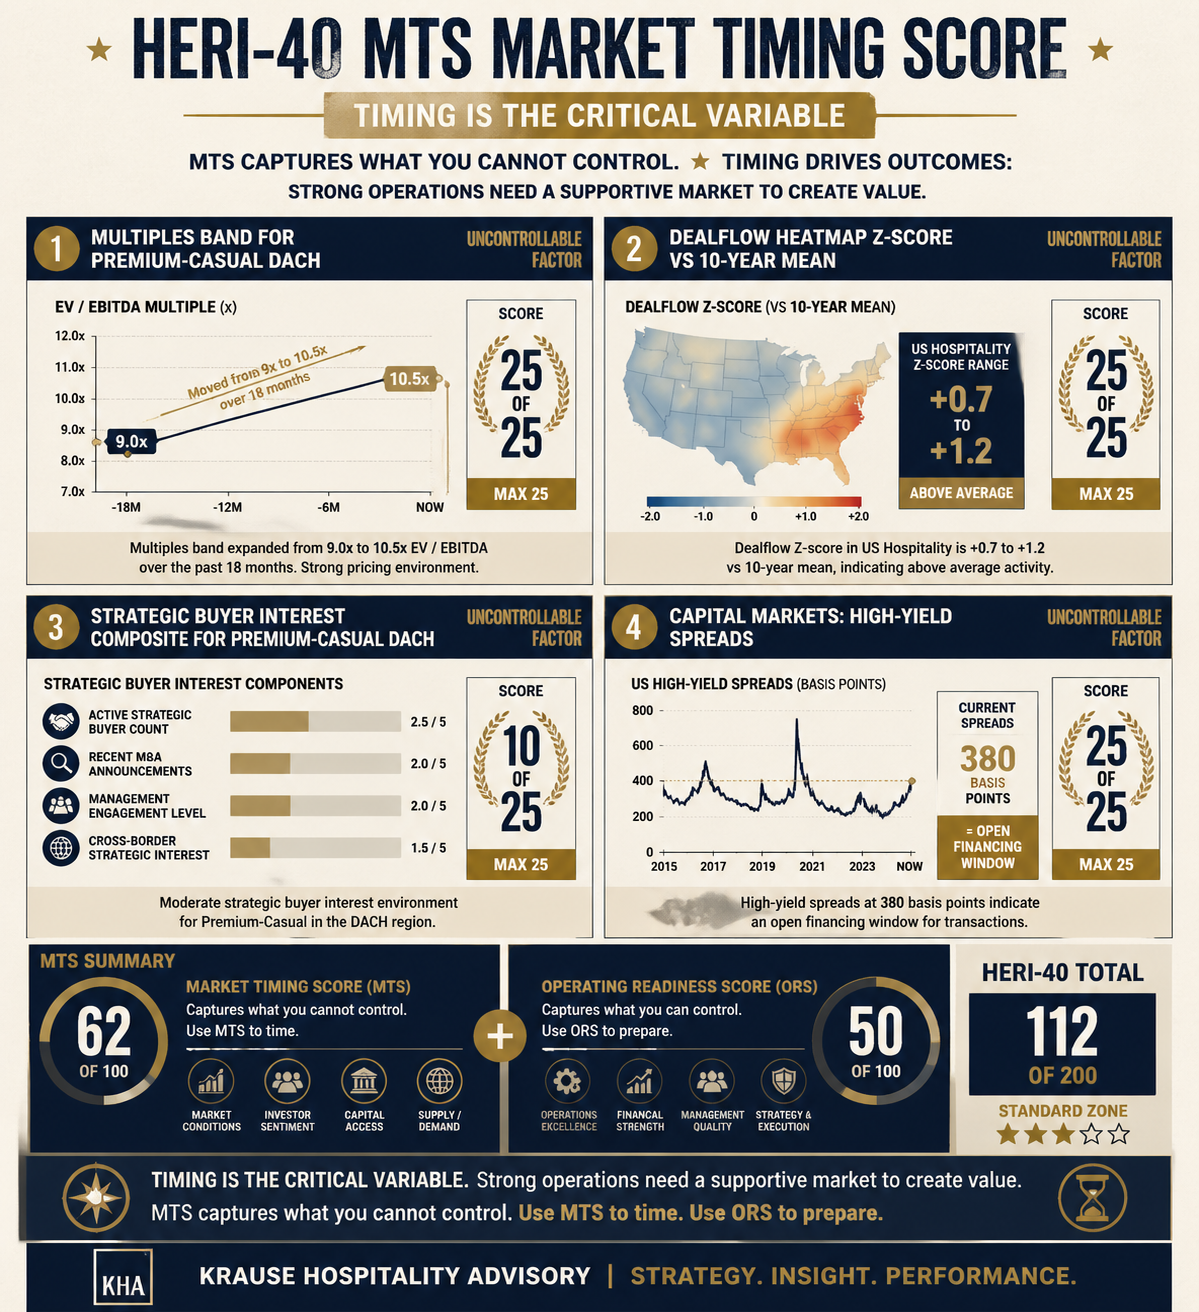
Sub-segment-typical P25–P75 spreads vary: QSR shows the widest dispersion at roughly 3.5×, because franchise systems with different asset-light depth compete there against each other. FastCasual sits at 2.8×, Casual at 2.2×, FineDining at 1.5×. A Premium-Casual operator in DACH observed a slight upward move of the sub-segment median between late 2024 and early 2026, from approximately 9× to approximately 10.5× over 18 months — a trend that falls into the "slightly rising" category and is rewarded accordingly at score assignment.
These figures reflect the data-validation state of April 2026. Once the downstream update research returns, the 2026 values in this subsection will be refreshed. The methodology itself does not change with that refresh.
5.1.4 Trend classification, rolling 12 months
Score assignment follows a five-stage classification of the trend direction over the last four quarters. Not the height of the median decides, but the movement:
- Falling ≥ 2 quarters: multiples have retreated over at least six months. Buyers wait for a floor; sellers postpone processes.
- Slightly falling or volatile: no clear direction; individual quarters fluctuate without signal.
- Stagnating: median moves within a ±5% corridor over 12 months.
- Slightly rising: upward trend +5% to +15% YoY.
- Rising ≥ 2 quarters: upward trend over at least six months, YoY growth above 15% with acceleration.
Five stages instead of three allow the intermediate zone "slightly rising" to be visible — the zone in which the typical consolidation exit takes place. A score that only distinguishes "rising", "stagnating" and "falling" would compress the majority of real trends into "stagnating".
5.1.5 Data sourcing, step by step
Here is how you compute B1 for your sub-segment yourself. The workflow is deliberately reproducible.
- Set up an SEC EDGAR filter with the keyword "Hospitality" or "Restaurant" on 8-K filings, DEF-14A proxy statements, and S-1 prospectuses. EDGAR is free; no account is required. The filter updates daily.
- For each new relevant filing, open the fairness-opinion appendix. The valuing banker (typically Piper Sandler, Houlihan Lokey, Jefferies) lists a comp set of eight to twelve peers with EV/EBITDA values. Those values go into your table.
- Quarterly, roll P25, P50 and P75 forward per sub-segment. A sample of 20 to 30 comps per sub-segment is typical after twelve months of build-out.
- Derive the trend direction from the comparison of median Q-current to median Q-minus-4. The plus/minus percentage change yields the classification from 5.1.4.
5.1.6 Score assignment 0–25 points
| Trend classification | Score |
|---|---|
| Falling ≥ 2 quarters | 0 |
| Slightly falling or volatile | 6 |
| Stagnating | 12 |
| Slightly rising | 18 |
| Rising ≥ 2 quarters | 25 |
Example Operator XY: Premium-Casual DACH, 47 sites. Tracks the sub-segment for two quarters. The median moved over the last four quarters from 9.2× to 10.5×, a YoY rise of approximately 14%. Classification: slightly rising trend (+5% to +15% YoY). B1 score: 17 points. One point below the nominal mapping value 18, because the trend sits at the upper edge of the category and XY does not yet consider the own sample size of 18 comps fully secured — a conservative self-assessment.
5.2 B2 — Hospitality dealflow heatmap (weight 25 points)
5.2.1 What the dealflow heatmap measures
B2 measures the actual transaction velocity in your sub-segment, not the number of announcements or the volume of media coverage. A "hot market" exists when above-average numbers of deals close. That creates buyer competition and pushes multiples up. A "cold market" is the inverse: a thinned-out buyer base, individual deals that drag on, valuation discounts as the rule. Between the two extremes sits a normal zone in which most quarters fall.
The methodological question: how do you identify a hot market without having PitchBook totals? The answer is a Z-score against the ten-year mean that normalises activity and makes market phases comparable.
5.2.2 The Z-score mechanism
The Z-score converts absolute deal count into a dimensionless deviation from the long-term mean. The formula: Z = (current trailing-12-months count − 10-year mean) / 10-year standard deviation.
A concrete worked example for US hospitality: the ten-year mean of closed hospitality M&A deals is 105 per year, with a standard deviation of 18. The current trailing-12-months count is 130. The Z-score resolves to (130 − 105) / 18 = +1.4. A value above +1.0 means significantly above-average activity — a hot market by statistical definition.
The typical Z-score range for hospitality deals runs from −2.0 in marked crisis phases (2009, Q2 2020) to +2.5 in peak consolidation phases (2017–2018, 2021–2022). Values outside that corridor are rare and merit case-by-case analysis.
5.2.3 FDD Item 20 transfer rate as a leading indicator
The US FDD prospectus mandates Item 20 disclosure of every franchise transfer movement. A franchisee sells an outlet, a multi-unit operator divests a sub-portfolio, a sponsor takes over individual sites from an existing system. These unit-level movements are documented in Item 20.
The methodological potential of Item 20: unit-level transfer waves are the leading indicator for institutional consolidation deals six to twelve months later. When the transfer rate rises in a sub-segment, roll-up and bolt-on deals at multi-unit volume typically follow in the next two to four quarters. PitchBook does not offer this leading indicator at that granularity in an automated feed — a methodological advantage for any operator who evaluates Item 20 systematically.
5.2.4 DACH data source — the DC Advisory insolvency heatmap
For the DACH region there is no central transaction register comparable to US Mergermarket. Destatis lags by 12 to 18 months, which makes federal statistics unusable as a live signal. The substitute is a proxy heatmap built on DC Advisory hospitality insolvency data.
The mechanism: insolvency clusters precede distressed deal waves. When multiple hospitality insolvencies are documented in the same sub-segment in a quarter, distressed transactions follow in the next two to four quarters, in which buyers take over assets or platforms out of insolvency proceedings. DC Advisory's quarterly reports deliver these insolvency counts for DACH with a latency of four to six weeks.
This DACH proxy heatmap complements the RFM Monitor 200 data stream, which is US-focused. Together both sources give a transatlantic signal that is also relevant for operators whose buyer base is a mix of DACH sponsors and US strategics. The DACH data gap is not fully closed but is methodologically compensated.
5.2.5 Z-score bandwidth and trends 2024 to 2026
Five interpretation zones for the Z-score:
- Z > +1.0: hot market. High buyer competition, Premium multiples likely. The ideal sale timing.
- +0.5 to +1.0: slightly above average. Normal-to-active market climate, solid dealflow.
- −0.5 to +0.5: normal zone. The market works, without a notable tailwind.
- −1.0 to −0.5: slightly below average. Buyers are more selective; processes drag.
- Z < −1.0: cold market. Thinned buyer base, valuation discounts standard, process postponements common.
Current US hospitality trend, validation state April 2026: between Z +0.7 and Z +1.2 over the last four quarters — a clear ascent out of the 2022/2023 trough. The DACH proxy heatmap shows a more moderate upward move in the same window, with the insolvency cluster rate retreating to 2019 levels. These values will be refreshed once the update research returns.
5.2.6 Score assignment 0–25 points
| Z-score | Score |
|---|---|
| Z < −1.0 | 0 |
| Z −1.0 to −0.5 | 6 |
| Z −0.5 to +0.5 | 12 |
| Z +0.5 to +1.0 | 18 |
| Z > +1.0 | 25 |
Example Operator XY: combines RFM Monitor 200 US numbers with the DC Advisory DACH proxy. The weighted trailing-12-months Z-score estimate for the Premium-Casual segment (US and DACH blended, weighted by expected buyer base) lands at +0.7. Classification: slightly above-average market. B2 score: 18 points. Solid market activity, but not a peak phase.
5.3 B3 — Strategic buyer interest signals (weight 25 points)
5.3.1 Why buyer psychology matters
A market with flat multiples but high strategic interest can be surprisingly attractive. B3 measures buyer activity and buyer language, not buyer prices. The question this component answers: are the top-10 strategics in your sub-segment in acquisition mood, or in consolidation pause?
The difference from B1 is material. B1 measures what buyers currently pay. B3 measures whether buyers want to buy. Both signals can diverge: in the early phase of a consolidation wave multiples are still moderate but strategic interest is visibly building. An operator who reads B3 early can start the process before the market lifts the multiples.
5.3.2 The four sub-components
B3 is a composite score from four sub-signals that together make up 25 points:
Component A — Investor statements (0 to 8 points). Press releases, annual letters and investor days of the top-10 strategics and top-10 PE sponsors in the target sub-segment are reviewed. Concrete hospitality allocations or "Active Acquisition Search" statements count as signal. Example source: McWin statement "Active European Foodservice Search" in the 2024 fund letter.
Component B — Analyst-call mentions (0 to 7 points). The quarterly earnings calls of listed hospitality platforms (Restaurant Brands International, YUM!, Darden, Cheesecake Factory, Bloomin' Brands) are scanned for the keywords "M&A", "roll-up", "bolt-on", and "tuck-in". Mentions are counted and contextualised qualitatively. A single "M&A" mention in an analyst Q&A counts less than a CEO statement in the prepared-remarks section.
Component C — 13D/13G filings and activism indicators (0 to 5 points). These SEC activism filings are hard, public, and unambiguous. A 13D filing signals an active equity position with intent to influence, often with M&A implications. Current 13D filings on hospitality tickers are checked monthly.
Component D — M&A press releases from top-10 strategics (0 to 5 points). Actual deal announcements from the identified top-10 buyers over the last six months count as signal. One deal per top-10 buyer in six months equates to roughly one point; two deals across different buyers equates to roughly two points, with a cap at five.
5.3.3 Tracking workflow
The workflow for the rolling B3 score can be set up as a systematic routine. Effort lands at 2 to 3 hours per week after the initial build-out month.
- Define your top-10 strategics list per sub-segment. For Premium-Casual DACH a plausible list is: McWin, L Catterton, Investindustrial, Triton, Bain Capital, Permira, EQT, Gilde Buy Out Partners, IK Partners, Capvis. The list is refreshed every twelve months.
- Set up Google Alerts for each of the ten names, combined with industry keywords ("restaurant", "hospitality", "foodservice"). Alerts run as an RSS feed into a reader.
- Subscribe to the RSS feeds of the investor-relations pages of the five most relevant sponsors.
- Weekly, read through the incoming news items and enter relevant signals in a simple table.
- Quarterly, aggregate the individual signals into the four composite components A to D and compute the overall B3 score.
5.3.4 Bandwidths and an example sub-segment
A concrete example composite for the Premium-Casual DACH segment in early 2026:
- Component A: McWin statement "Active European Foodservice Search" from the 2024 fund letter plus L Catterton hospitality allocation note in the 2025 annual letter. Score 5 out of 8.
- Component B: listed Premium-Casual in DACH is thinly populated. Analyst-call mentions at RBI, YUM! and Darden with Premium-Casual relevance remain sporadic. Score 3 out of 7.
- Component C: 13D/13G filings with Premium-Casual relevance in the observed window: none. Score 0 out of 5.
- Component D: one documented M&A press release in the last six months (a mid-sized acquisition by one of the top-10). Score 2 out of 5.
Composite sum: 10 out of 25. Classification: mid-range activity in the Premium-Casual segment. For comparison: US QSR shows composite values in the corridor 16 to 20 in the same window, DACH Casual overall between 8 and 12. Premium-Casual DACH therefore sits in the middle band of the segment-specific range.
Example Operator XY: composite sum 10 of 25, computed as above. The B3 score is taken over directly as the MTS contribution (analogous to the B4 logic). B3 score: 10 points. Interpretation: moderate buyer activity, no peak, no vacuum.
5.3.5 Subjectivity disclaimer and consensus scoring
Components A and B contain interpretive judgement. What counts as an "Active Acquisition Search" statement? Is a single line in a fund letter a signal or routine communication? These questions cannot be answered mechanically.
The robust methodology follows the same pattern as the A3 component in Section 4: three independent scorers (founder or CFO, COO, external M&A advisor) score in parallel; the median per component is adopted as the consensus value. Where a component diverges by more than three points, the scorers discuss the case jointly and document the rationale for the consensus value.
Buyer-side verification in due diligence takes place through presentation of the source filings and transcripts. No due-diligence team accepts a B3 score without the originating source documents. That is not a problem but a discipline of the methodology: the score is provable, not guessed.
5.4 B4 — Capital-markets window (weight 25 points)
5.4.1 Why the financing climate is decisive
Over 70% of hospitality M&A transactions are executed by leverage buyers — private-equity sponsors who finance a portion of the purchase price via debt. When debt costs rise, the maximum purchase price a buyer can offer at the same target return falls. Focus Investment Banking has quantified the relationship: a 100-basis-point rate change shifts hospitality EV/EBITDA multiples on average by approximately 0.5 points. At a current Casual median of roughly 10×, that equates to a multiple shift of 5% driven purely by the rate environment.
A market with active strategics (high B3 score) but a closed capital-markets window is thinned out nonetheless. The strategics are willing but unable to finance. B4 measures that structural capital availability as a stand-alone dimension.
5.4.2 The three sub-components
B4 is a composite score from three sub-signals:
Component A — High-yield spread level (0 to 10 points). The reference metric is the ICE BofA US High Yield Consumer Index Option-Adjusted Spread, one of the most frequently cited gauges for the high-yield financing climate. Score assignment: below 300 basis points very open (10 points), 300 to 400 basis points open (8), 400 to 500 neutral (6), 500 to 600 restrictive (3), above 600 basis points closed (0).
Component B — Consumer IPO activity, last 6 months (0 to 8 points). The number of closed consumer IPOs in the trailing six months is a proxy for the risk-on climate of the public capital markets. Score assignment: four or more IPOs very active (8 points), two to three active (5), one sparse (2), none closed (0).
Component C — Dry-powder estimate for hospitality-focused PE funds (0 to 7 points). Sources are aggregated Preqin public reports and the Bain Global PE Report, both available with 3 to 6 months of lag. Score assignment: dry powder above USD 25 billion allocatable to hospitality high (7 points), between USD 10 and 25 billion medium (4), below USD 10 billion low (1).
The B4 composite is the sum of the three components, capped at 25 and floored at 0.
5.4.3 Data sourcing, step by step
The sources for B4 are predominantly free to access:
- HY spread: daily availability via the FRED database (Federal Reserve Economic Data) under the series BAMLH0A0HYM2. No account required; download as a time series is possible.
- Consumer IPOs: SEC EDGAR with the sector filter "Consumer Discretionary" on S-1 filings. Build a quarterly list and mark completed IPOs (S-1/A updates and actual pricing news).
- Dry powder: Preqin public reports (limited free access), Bain Global PE Report (annual, free, with hospitality-relevant breakouts), alternatively PitchBook free tier. Aggregate the three sources for a plausible estimate.
5.4.4 Subway WBS as an edge case
The Subway sale of 2023 (discussed in detail in Section 1.8, Section 2.4, and Appendix A) shows that innovative financing structures can widen the capital-markets window for individual deals even when classic HY spreads are high. Whole-business securitisation structures securitise the chain's cashflows directly and enable higher leverage ratios than conventional LBO financing. Relevance for DACH operators: some European franchise systems are evaluating analogous structures in cooperation with investment banks. The observation belongs in your B3 tracking workflow, not in the B4 composite calculation.
5.4.5 Bandwidth and trends 2024 to 2026
Current trend, validation state April 2026: HY spreads tightened materially from mid-2024, from approximately 520 basis points to approximately 380 basis points in early 2026. Consumer IPO activity recovered from a thin 2022/2023 phase to two to three IPOs per half-year. Dry-powder estimates for hospitality-focused PE funds remain high, because the 2023 and 2024 fund vintages are still in investment mode.
The typical B4 composite score in the US market currently lies between 17 and 22 of 25, equivalent to an open to wide-open window. DACH-specific vehicles (structured franchise financings, DACH mid-market PE funds) show somewhat lower readings, because the European leveraged-loan market is less deep in that segment than the US market. These values will be refreshed once the update research returns.
5.4.6 Score assignment 0–25 points
Unlike B1 and B2, B4 does not require an additional trend classification. The composite score is already defined on the 0-to-25-points scale and is taken over one-for-one as the MTS contribution.
| B4 composite | Score | Interpretation |
|---|---|---|
| 0 to 7 | 0–7 | Window closed |
| 8 to 14 | 8–14 | Restrictive |
| 15 to 20 | 15–20 | Open |
| 21 to 25 | 21–25 | Wide open |
Example Operator XY: HY spread in early 2026 at approximately 380 basis points, score component A = 8. Consumer IPO activity three IPOs in the last six months, component B = 5. Dry-powder estimate medium (hospitality allocation between USD 10 and 25 billion), component C = 4. Sum: 17 of 25. B4 score: 17 points. Interpretation: open window, active leverage-buyer base.
5.5 MTS sum, HERI-40 total, and transition to Section 6
5.5.1 Example Operator XY — the MTS sum
Operator XY has now computed four B-component values, consistent with the tracking workflow over the last two quarters.
| Component | Core reading | Score | Maximum |
|---|---|---|---|
| B1 Sub-segment multiples | Median +14% YoY (slightly rising) | 17 | 25 |
| B2 Dealflow heatmap | Z-score +0.7 | 18 | 25 |
| B3 Strategic buyer interest | Composite 10/25 (mid-range activity) | 10 | 25 |
| B4 Capital-markets window | Composite 17/25 (open window) | 17 | 25 |
| MTS sum | 62 | 100 |
Classification: an active market window, neither hot nor cold. Three of four components sit in the upper normal range; only B3 remains in the middle activity band. No single component drives the score to either extreme. Operator XY therefore sells into a market environment that permits solid multiples and offers a sufficiently broad buyer base.
5.5.2 ORS plus MTS equals HERI-40 total
Operator XY's HERI-40 total score is the addition of both dimensions: ORS 50 from Section 4.6.1 plus MTS 62 from 5.5.1 equals HERI-40 = 112. The preliminary placement against the zone model from Section 1.3: Standard zone, defined as the score corridor 100 to 129.
The meaning of that placement is unpacked in Section 6. In short: a trade is feasible, but synergy pressure on the buyer is high, and the valuation-compression risk without clearly identifiable Premium drivers (management depth, consistency, scaling proof) is tangible. Operator XY stands at the transition from mid-market to Premium, but not yet clearly inside the Premium zone.
5.5.3 Transition to Section 6
Your HERI-40 score is computed; your zone is identified. Section 6 explains what the four zones mean concretely: which buyer types are active, which multiple bandwidths are realistic, what negotiating position you hold, and which strategic options remain open. Section 7 presents the worked example L'Osteria as a fully computed Premium-level reference case. Section 8 delivers the 12-month roadmap per zone, with concrete levers for zone migration.
Related research
- The roll-up playbook in European hospitality: where multiple arbitrage still works
- Parent-company DNA as a valuation variable: KFC Germany and Taco Bell's USD 60 million miss
- Multiple compression in mid-market foodservice: reading the 2024–2025 corridor
- HERI-40 Section 1: Executive Summary
- HERI-40 Section 2: Market Context 2026
- HERI-40 Section 4: The ORS Dimension
Sources
- Hyde Park Capital: Quarterly Hospitality Multiples Reports
- Focus Investment Banking: Agribusiness and Foodservice Quarterlies (Q3 2025, H1 2025)
- SEC EDGAR: DEF-14A fairness opinions (Piper Sandler, Houlihan Lokey, Jefferies comp sets)
- Restaurant Finance Monitor 200
- FRED: ICE BofA US High Yield Consumer Index Option-Adjusted Spread (series BAMLH0A0HYM2)
- DC Advisory: DACH hospitality insolvency quarterly reports
- Preqin: aggregated public dry-powder reports
- Bain & Company: Global PE Report
- US FDD Item 20: franchise transfer disclosures