3.1 What Rule of 40 does in SaaS
Every PE analyst who has underwritten software deals since 2017 knows the rule. Rule of 40: a software-as-a-service company is financially healthy when the sum of its annual revenue growth rate and its free-cashflow margin reaches at least 40 percent.
Brad Feld popularised the formula in a 2015 blog post. The idea had been circulating before that in boardroom conversations among several SaaS investors, Scott Maxwell (OpenView) among them. The underlying logic: a SaaS company growing 20 percent with a 20 percent cashflow margin is just as healthy as one growing 40 percent with zero margin. The additivity is what makes the statement load-bearing. Growth and profitability are interchangeable, as long as the sum lands.
Bessemer Venture Partners adopted the rule in its annual State of the Cloud report in 2017. OpenView Venture Partners introduced it as a headline metric in its SaaS Benchmarks publication from 2019 onwards. Both publications are today the reference material that CFOs, board members, and investors use to sort SaaS companies into sub-categories. The number has carried, even though dozens of academic alternatives have been proposed.
Why did Rule of 40 carry? Three reasons.
First: one number is more tractable than two. A board meeting can debate one number. Two numbers generate trade-off debates that in practice usually end inconclusively.
Second: the threshold value of 40 is a discussion hook. Every outlier has to be explained, every shortfall has to be defended. That forces disciplined conversations.
Third: the rule is falsifiable. Backtests against IPO cohorts have shown that companies below the threshold systematically trade at a discount to the sector multiple. The rule is not merely intuition — it is empirically load-bearing.
For the HERI-40 methodology, all three properties matter. The SaaS analogue is not a marketing parallel. It is a functional principle borrowed deliberately.
3.2 Why the translation to hospitality is defensible
The objections to a translation are legitimate. SaaS and hospitality differ in their central revenue logic: software generates recurring revenue (MRR, ARR), hospitality generates transactional revenue (per visit, per order). What Net Revenue Retention measures in SaaS does not port one-for-one onto restaurant cohorts.
Three structural parallels nevertheless make the translation defensible.
The first parallel is multi-unit scaling with a platform effect. A multi-unit hospitality operator scales not through single-unit growth but through replication. A mature system has centralised services — procurement, marketing, HR, technology — and decentralised operations. That is precisely the structure of a SaaS firm with centralised product development and a decentralised customer base. In both cases the buyer is pricing platform quality, not single-unit performance.
The second parallel is cohort logic. In SaaS, an investor tracks cohorts of customer-acquisition vintages and measures how quickly they reach the maturity level of older cohorts. In hospitality, the same investor tracks cohorts of site-opening vintages and asks the same question: how quickly does a 2023 cohort reach the revenue level of the 2018 cohort? The metric is called cohort maturity and is operationalised in ORS component A4.
The third parallel is multiple variation by profile. In SaaS, investors pay very different multiples for the same headline growth rate, depending on whether profitability is secured. In hospitality the same principle applies, only displaced: investors pay very different multiples for the same site count, depending on whether single-unit profitability is stable across all cohorts or dispersed. That dispersion is operationalised in HERI-40 as ORS component A2 (unit-EBITDA dispersion) — and in the retrograde backtest (Appendix A) was the single strongest signal for subsequent distressed trajectories.
Where the translation does not hold, it is substituted explicitly. Where SaaS measures Net Revenue Retention, HERI-40 measures mature-store consistency. Where SaaS quantifies CAC payback, HERI-40 quantifies flow-through margin. The formula is not identical, but the underlying logic — reproducible scaling with defensible profitability — is the same.
Two independent deep-research passes in 2025 systematically tested whether the hospitality advisory literature already carries an equivalent integrated metric. Both passes returned the same finding: no direct competitor. Both explicitly recommended SaaS Rule of 40 as the most usable cross-sector template.
3.3 The two dimensions — orthogonal, not redundant
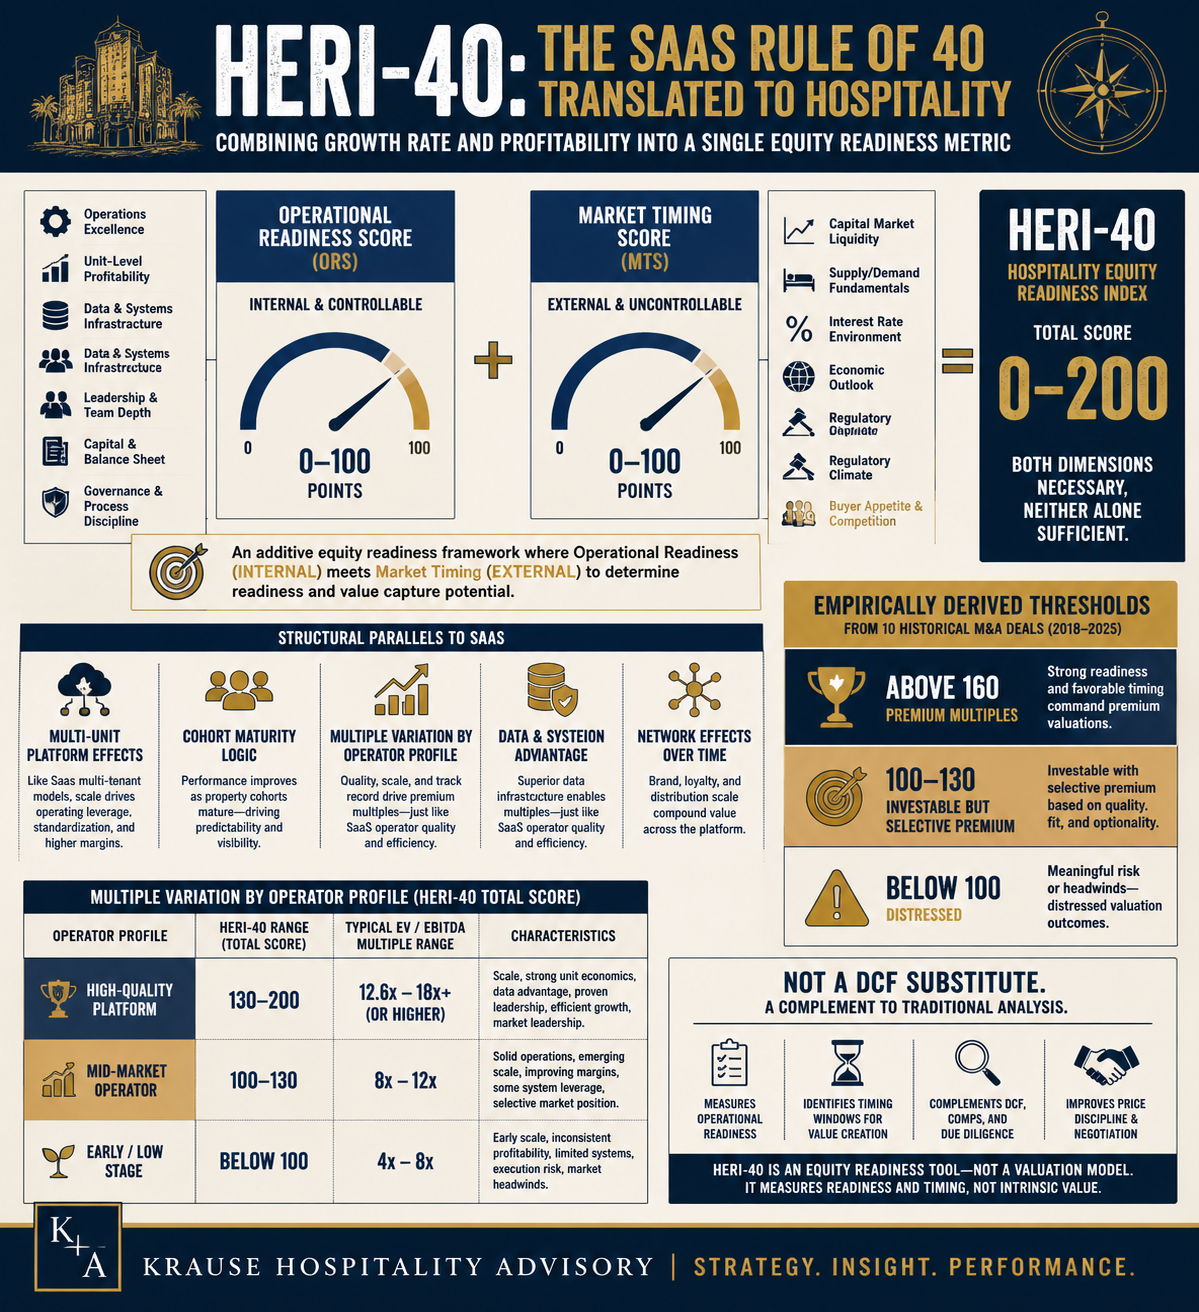
HERI-40 has two dimensions: the Operational Readiness Score (ORS) and the Market Timing Score (MTS). The two add together. That raises a question every analyst will ask: why two dimensions instead of one? Why additive instead of multiplicative?
The answer: ORS and MTS measure fundamentally different things — things you control versus things you do not control — and their effects in the actual transaction are not redundant.
ORS measures internal selling readiness. You can improve flow-through margin by restructuring cost bases. You can reduce unit-EBITDA dispersion by closing or professionalising weak sites. You can build management depth by staffing leadership positions away from founder dependency. These levers sit in your hand.
MTS measures the external market window. You cannot influence sub-segment multiples. You cannot increase the number of closed hospitality LBOs per quarter. You cannot open the capital-markets window. These levers do not sit in your hand. You can only decide whether to use the current window or wait for the next one.
What happens when one of the two dimensions is missing? The retrograde backtest in Appendix A supplies the answer.
Take a hypothetical operator with ORS 90 (Platinum level of internal readiness) and MTS 30 (weak market window). The sum would be 120 — Standard zone. In practice, that is a company operationally perfectly prepared, but selling into a market in which no matching buyers are active. Multiple discount, markdown risk, frequent deal abandonment. Vapiano 2019 through 2020 was not a pure ORS-only case, but the combination of deteriorating ORS and a collapsing MTS driven by the casual-dining crisis plus the Covid market illustrates the pattern: without a market window, the best preparation is worth little.
Take the inverse: a hypothetical operator with ORS 30 (fragile operations) and MTS 90 (extremely hot market window). The sum would again be 120 — Standard zone. In practice, that is a company written up by the market before due diligence finds the issues that either block the deal or force price reductions. BurgerFi after its 2020 SPAC merger is the textbook example: high MTS expectations driven by SPAC momentum met an ORS base that could not carry them. The result was a markdown, then a distressed phase, then insolvency.
The additivity ensures that both dimensions are necessary. A multiplicative structure would be too harsh — an MTS of 20 would drag an ORS of 80 down to a score of 1,600 on a 0–10,000 scale and devalue the ORS build-up. Additivity respects that both internal readiness and external window contribute, but that neither alone is sufficient.
3.4 Why 40 as the identity number and why 100, 130, 160 as thresholds
The number 40 in the name is branding. The numbers 100, 130, and 160 are empirics. That distinction matters, because it is regularly confused.
40 is a borrowing from the SaaS meme. It delivers three functions: recognisability in every conversation with a PE analyst or a banker (Rule of 40 is industry knowledge), a semantic bridge to the analogue methodology, and a discussion hook in every first meeting ("why 40 in the name when the scale goes to 200?"). Answering that question opens the conversation.
The 0–200 scale is arithmetic: two dimensions at a maximum of 100 points each sum to 200. The identity number 40 remains as a branding hook, even though no direct threshold function hangs on it.
The operative thresholds — 100, 130, and 160 — are the output of a retrograde backtest (Appendix A documents it in full). Ten closed hospitality M&A deals between 2018 and 2025 were recomputed using publicly available data. The deals span the full spectrum — premium IPOs, strategic trades, mid-market deals, distressed scenarios.
The result: premium-multiple deals above 15× EBITDA scored above 130 without exception. Distressed scenarios scored below 100 without exception. Not a single deal crossed a threshold in the wrong direction. The 160 boundary was set by the Platinum deals (Dutch Bros above 30×, Jersey Mike's 24–26×, CAVA above 70×) carrying scarcity-premium characteristics.
The load-bearing point: the thresholds are not derived from the number 40. They are calibrated from empirics. Had the backtest produced different numbers, different thresholds would have been set. The 0–200 scale is the mathematical frame, the 40 is the branding, the 100/130/160 are the empirics.
3.5 What HERI-40 is not
Three omissions belong inside the definition.
First: HERI-40 is not a point-valuation estimator. The score says nothing about the specific EV/EBITDA multiple a chain would achieve in a concrete transaction. A HERI-40 of 145 does not mean "you will sell at 12×". It means: you are in the Premium zone, in which buyers are willing to go above the sub-segment median. The concrete multiple depends on sub-segment, geography, buyer type, and negotiation dynamics.
Second: HERI-40 is not a substitute for a banker or advisor. A credible transaction requires due diligence, legal review, tax structuring, and negotiation capability. HERI-40 replaces none of that. It structures the pre-mandate discussion and makes banker conversations more efficient, because the operator already knows what has to be defended and where the chain realistically stands.
Third: HERI-40 is not a DCF model. Discounted cashflow remains the more precise valuation technique for a specific purchase price. HERI-40 measures a different dimension: readiness and timing, not enterprise value. The two are complements. For the transaction decision, both are required — DCF for the price dimension, HERI-40 for the time dimension and the operations-readiness dimension.
HERI-40 is a readiness signal with a window context. Nothing more, nothing less.
Related research
- The roll-up playbook in European hospitality: where multiple arbitrage still works
- Parent-company DNA as a valuation variable: KFC Germany and Taco Bell's USD 60 million miss
- Multiple compression in mid-market foodservice: reading the 2024–2025 corridor
- HERI-40 Section 1: Executive Summary
- HERI-40 Section 2: Market Context 2026
Sources
- Feld, Brad (2015): "The Rule of 40% For a Healthy SaaS Company", feld.com
- Bessemer Venture Partners: State of the Cloud reports, 2017 onwards
- OpenView Venture Partners: SaaS Benchmarks publications, 2019 onwards
- HERI-40 Appendix A: retrograde backtest against 10 hospitality M&A transactions 2018–2025