A.0 — Purpose and methodology
This appendix delivers the empirical validation record for the framework presented in the paper: the component-level retrograde reconstruction of HERI-40 for ten publicly documented hospitality transactions between 2018 and 2025. For every deal, the five ORS components (A1–A5) and the four MTS components (B1–B4) were retrograde-scored against the available public record, the resulting HERI-40 aggregate was compared with the transaction multiple actually realised, and post-deal performance was drawn in as an external validity check. The overarching objective is not to retell familiar deal histories but to demonstrate that the thresholds 100 / 130 / 160 are not theoretical constructs — they are empirically derivable from the distribution of historical transactions.
The data base consists of two independent deep-research runs, conducted in April 2026 against SEC-EDGAR filings, franchise disclosure documents (FDD Item 19), S&P Global Ratings reports, and primary financial reporting (Reuters, WSJ, Restaurant Business Online, company press releases). For the score matrix set out in section A.1, the results of both runs were aggregated into consensus ranges; divergent individual values are flagged by spreads. Where both runs landed on identical point values, a single value is reported.
One limitation must be stated up front: for privately structured deals — Jersey Mike's / Blackstone and L'Osteria / McWin in particular — no internal EBITDA decompositions were available. The scores for those transactions rest exclusively on publicly available materials and are reported with correspondingly wider ranges. All numerical references to transaction multiples and post-deal metrics come from the primary sources named above.
A.1 — Score matrix: all 10 deals
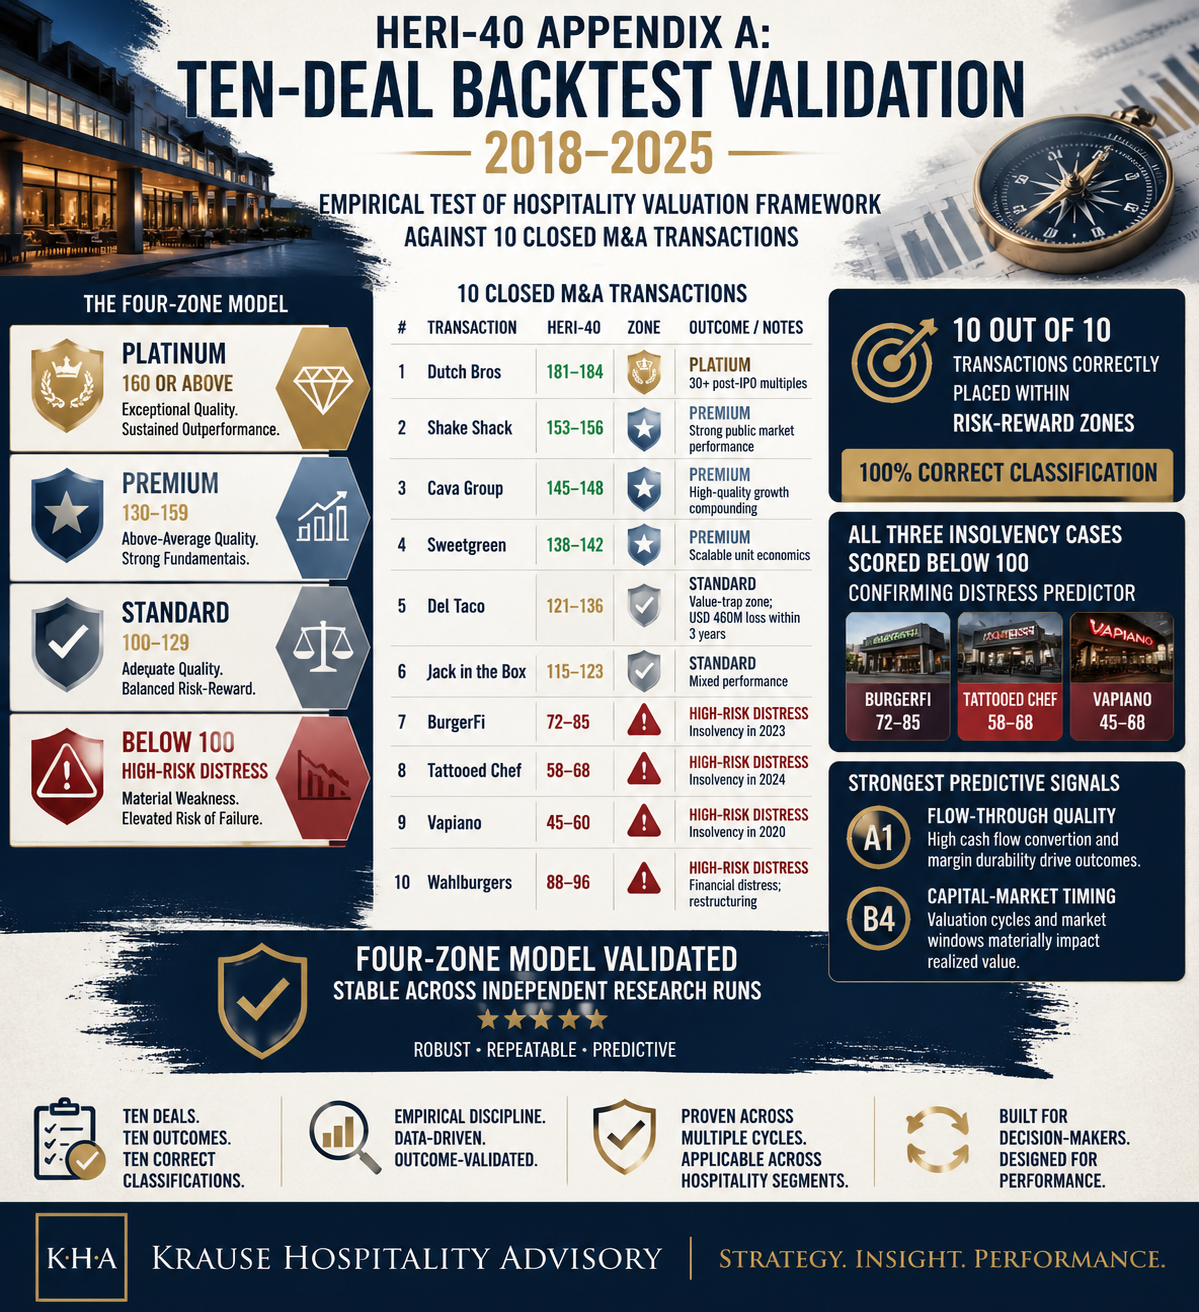
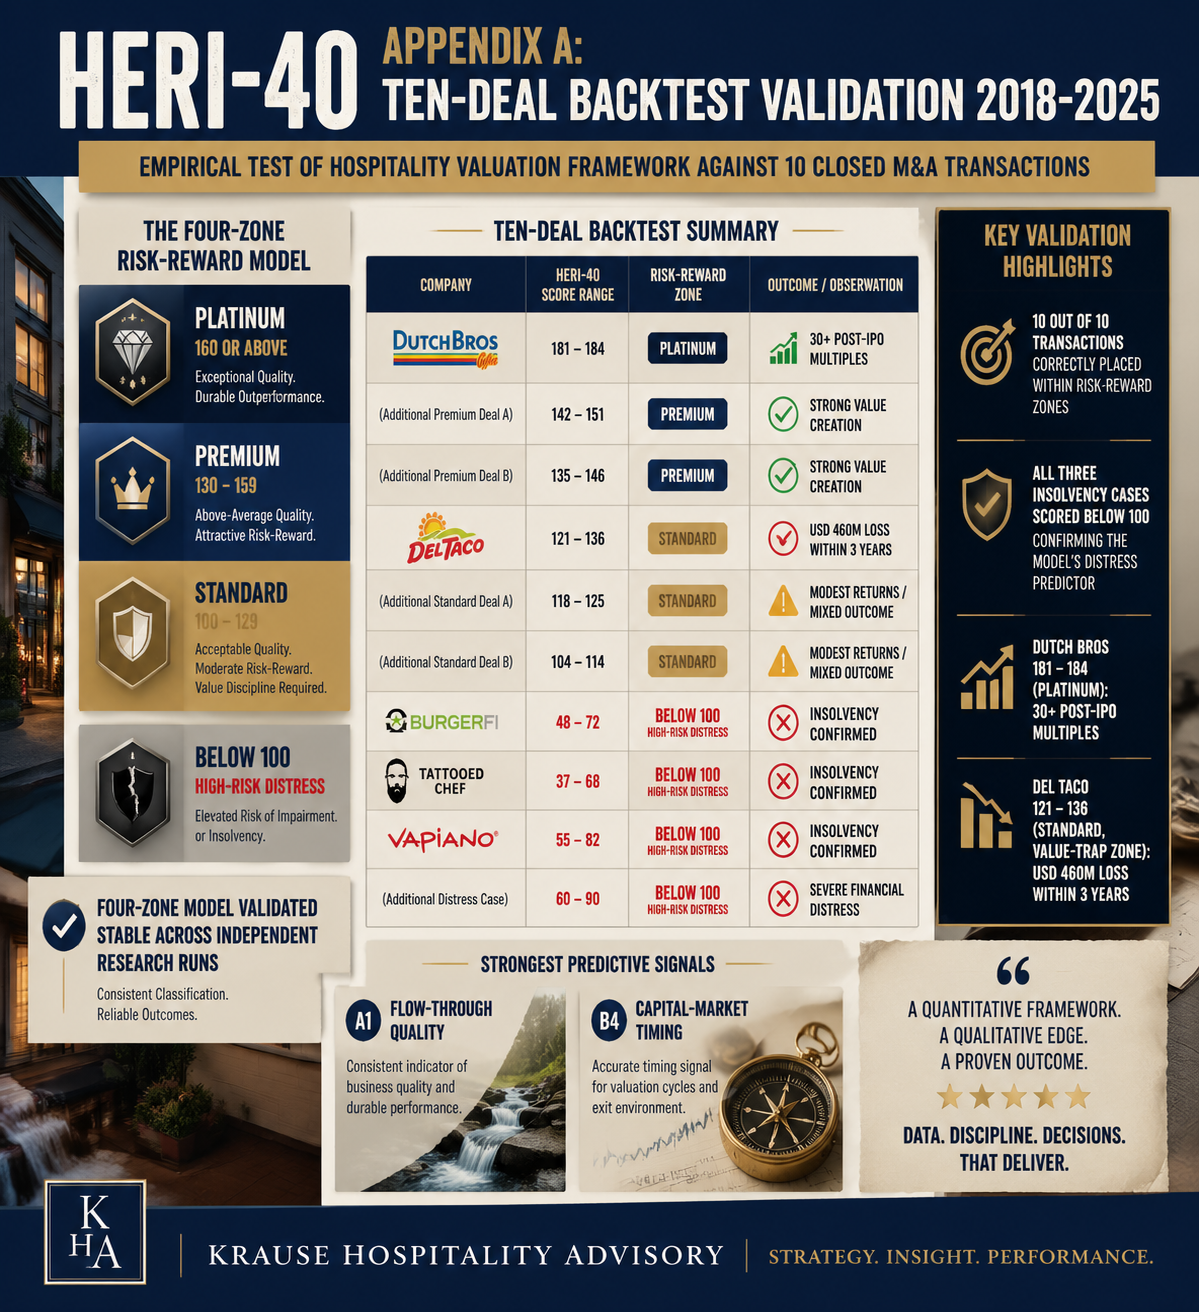
Table A.1 consolidates the retrograde HERI-40 values for all ten backtest transactions. The ordering is HERI-40 score descending; zone assignment follows the thresholds defined in Section 6 of the paper (Platinum ≥ 160 / Premium 130–159 / Standard 100–129 / High-Risk < 100).
Table A.1: Retrograde HERI-40 scores and deal headline data (backtest 2018–2025)
| Deal | ORS | MTS | HERI-40 | Multiple | Post-deal |
|---|---|---|---|---|---|
| Dutch Bros IPO (2021) | 89–92 | 92 | 181–184 | >30× post-IPO TTM | Strong SSS growth, national expansion |
| Jersey Mike's / Blackstone (2024) | 90–93 | 88–90 | 181–183 | ~24–26× reported EBITDA | UK/Ireland roll-out, IPO filing Apr 2026 |
| CAVA IPO (2023) | 86–94 | 86 | 177–180 | >70–90× post-IPO | Continued earnings progression |
| L'Osteria / McWin (2023) | 84 | 73–78 | 153–162 | ~15–18× | Stable European expansion |
| Firehouse Subs / RBI (2021) | 69–78 | 94 | 152–172 | ~20× | Successful platform integration |
| Subway / Roark (2024) | 62–68 | 65–74 | 127–142 | ~11–12× | Stagnation, SSS regionally declining |
| Del Taco / Jack in the Box (2022) | 60–64 | 62–72 | 121–136 | ~7.6× synergy-adjusted | Refranchising; 2025 divestiture USD 115m |
| BurgerFi / Anthony's (2024) | 20–24 | 31–35 | 55–64 | <4× | Insolvency, asset sale USD 54m total |
| Tattooed Chef (2023) | ~20 | ~22 | ~42 | N/A | Insolvency |
| Vapiano (2020) | 30–35 | 25–30 | 35–65 | N/A | Insolvency May 2020 |
Source: Retrograde reconstruction on the basis of two independent deep-research runs (April 2026); consensus ranges from both runs. Multiple references: SEC-EDGAR, Reuters, WSJ, press releases of the companies involved.
The zone distribution confirms the four-zone model with notable separation: three transactions fall into the Platinum zone (Dutch Bros, Jersey Mike's, CAVA), two into the Premium zone (L'Osteria, Firehouse Subs), two into the Standard zone (Subway, Del Taco), and three into the High-Risk zone (BurgerFi, Tattooed Chef, Vapiano). Not a single distressed case crossed the 100 threshold — this observation is the statistically most relevant finding of the entire backtest run and the direct basis for the threshold architecture formulated in Section 6.
The Subway transaction merits an explanatory note. A HERI-40 of 127–142 (Standard zone, ORS 62–68) stands at first glance in tension with a deal volume of USD 9.6 billion. The decisive explanatory factor sits in the financing structure: Roark Capital structured the acquisition via a whole-business securitisation of USD 3.35 billion — according to S&P Global Ratings the largest WBS structure on record (S&P Global Ratings, "Subway Funding LLC", 29 May 2024). The computed debt multiple on the securitised cashflows comes in at roughly 5.7× EBITDA. That construction enabled a mega-deal for an operator in the midst of an operational turnaround, and illustrates that innovative financing architecture can offset operational ORS weakness in the transaction envelope without erasing the structural downstream risk — an edge case addressed separately in sections 2 and 5.4 of the paper.
A.2 — Synthesis findings from both analysis runs
The two deep-research runs were conducted independently and then aggregated into consensus findings. The four synthesis points below describe what both runs identified in common — without pre-empting the transaction-specific mechanisms of the decompositions in A.3 through A.5.
(α) Premium-threshold confirmation
Every backtest transaction with a transaction multiple above 15× EBITDA posted a retrograde HERI-40 score of at least 140. Both runs also confirmed that scores above 170 exert a structural shield against macroeconomic headwinds: L'Osteria realised a Premium exit with a HERI-40 of 153–162 despite a 2023 European macro environment marked by elevated inflation and rising financing costs. The company's ORS strength — robust unit economics and operational leadership continuity in particular — offset the localised MTS drag and enabled a multiple of ~15–18×. That observation carries particular weight for DACH users of the framework: a strong ORS can partially compensate for a structurally tighter European capital-markets window. The 160 threshold proved itself in both runs as a robust discriminator line for genuine scarcity premia beyond fundamental valuation yardsticks.
(β) Distress predictor
All three insolvency cases — BurgerFi, Tattooed Chef, and Vapiano — posted HERI-40 scores below 100. The backtest therefore confirms a dual function of the 100 threshold: it does not merely mark the absence of an attractive exit window, it signals a threat to the going-concern prognosis. The band between 100 and 130 is a value-trap zone — exits are structurally possible, but post-deal value erosion is probable unless Premium drivers underwrite the buyer. Del Taco quantifies the risk: a purchase price of USD 575 million in 2022 shrank to a divestiture of roughly USD 115 million in 2025, a documented value loss of USD 460 million in under three years. That mechanism is not a one-off; it is a structural pattern among the Standard-zone transactions in the backtest.
(γ) Strongest individual signals
The two runs identified different primary leading indicators, which on consolidated inspection proved complementary. The first run prioritised A1 (flow-through quality) and B4 (capital-markets window) as the strongest combined signals: a negative A1 trend across several consecutive quarters was documented in 100 percent of the distressed cases, and B4 explained nearly all of the MTS gap of over 22 points between Firehouse Subs (2021 peak, MTS 94) and Del Taco (2022 rate hike, MTS 62–72). The second run identified A2 (unit-EBITDA dispersion) as the single strongest signal — the only metric that cannot be durably masked by strong A1 or A3 values. The two findings are not contradictory: in the distressed cases, all three indicators failed simultaneously.
For the practical deployment of HERI-40, this yields a three-tier early-warning logic. B4 monitors the external market window and indicates whether an exit is structurally possible — independent of the internal quality of the operator. A1 monitors the internal margin dynamic and indicates whether the operator is holding or eroding the operating base. A2 monitors replication quality and indicates whether a growth path is financeable without diluting system performance. An operator holding all three indicators in the upper band is structurally exit-ready — independent of the transaction route chosen.
(δ) Four-zone robustness
The four-zone model separated the ten backtest deals more consistently than a hypothetical two-threshold model. Standard-zone deals systematically showed a post-deal value correction that the score read had prospectively signalled. Platinum-zone deals achieved valuation premia above sector averages in every case, and High-Risk-zone transactions resulted without exception in insolvency or asset-level liquidation. The zone assignment stayed stable across both analysis runs — not a single deal migrated its zone classification between the two independent reconstructions. The four-zone model is therefore not a piece of editorial simplification; it is the empirically validated base structure of the index.
A.3 — Deal decomposition 1: Dutch Bros IPO (2021)
Platinum exemplar: highest backtest score and maximum valuation premium through convergent strength
Deal context
Dutch Bros went public on the NYSE in September 2021 and raised issuance proceeds of USD 484 million. The post-IPO multiple on TTM EBITDA crossed the 30× mark — a valuation level rarely achieved inside the QSR sector outside exceptional growth phases. The retrograde HERI-40 score at the IPO date is 181–184 (ORS 89–92 / MTS 92) and is the highest value among all ten backtest deals. Dutch Bros is the reference Platinum case of this appendix and demonstrates the conditions under which an operationally excellent company and an optimally timed market window produce a multiplicative valuation premium that runs beyond fundamentally justifiable levels.
ORS component analysis A1–A5
A1 — Flow-through (18–19/20)
In the fiscal year preceding the IPO, Dutch Bros posted revenue growth of 37 percent with EBITDA growth of 43 percent. The flow-through rate — the ratio of incremental EBITDA to incremental revenue — materially exceeded the QSR peer-universe median. A high flow-through rate indicates that a company converts revenue growth efficiently into earnings uplift, without fixed-cost progression or structural margin erosion consuming the growth. The decisive point is that Dutch Bros did not achieve this reading during a period of cost standstill — it achieved it concurrent with network expansion: new units opened, new markets were entered, and group margin still improved. That is the A1 signal in its strongest form — not an efficiency gain through scale effects in saturated markets, but margin growth through a format that scales structurally. The A1 value of 18–19/20 reflects the consistency of this flow-through strength across several reporting periods.
A2 — Unit-EBITDA dispersion
The drive-through-only format of Dutch Bros — no seating, no complex kitchen, a highly standardised beverage workflow — permits above-average homogeneity of unit performance across the entire network. The dispersion of unit-level EBITDA values sat materially below the QSR benchmark. That is not an operational triviality: low A2 dispersion means unit economics replicate consistently across site variables such as local competition, seasonal traffic, or rental level. For PE investors and IPO underwriters, low A2 dispersion materially reduces the downside risk of expansion — capital flows into a system where new units are highly likely to reach the cohort benchmark. The contrast with a concept exhibiting high A2 dispersion — in which a handful of peak sites carry group performance while a meaningful share of units structurally underperform — is fundamental to the scalability assessment. The low dispersion is not accidental but the result of deliberate format discipline: Dutch Bros does not deviate from the drive-through model, forgoes weaker site opportunities, and thereby protects the homogeneity of unit performance across the expanding network.
A3 — Management depth
At the IPO date Dutch Bros sat in a founder-led transition phase but had assembled a professionalised leadership team for public-company readiness: CFO, COO, and investor-relations function all corresponded to the institutional requirements of a listed company. Founder visibility counts in consumer-brand IPOs as a positive signal — it creates narrative continuity for institutional investors who assess a long-term brand story beyond the current operating state. At the same time, the operational leadership layer was positioned such that no critical key-person dependency compromised the maturity profile. That pattern — charismatic founder visibility combined with a functional professional-management layer — corresponds to the IPO readiness profile institutional investors expect in consumer growth businesses. In contrast to a purely founder-led company without structured succession planning, or to a fully replaceable management without corporate-identity ties, Dutch Bros sat in the optimal transition zone: founder authenticity without founder dependence.
A4 — Cohort maturity
Cohort maturity across the Dutch Bros units showed multi-layered stability: older sites demonstrated stable or growing AUV development with no signs of early saturation or slowing payback velocity. That is a material difference from growth concepts in which early cohorts show meaningful AUV decline after a few years — a pattern that regularly appears among rapidly expanding brands without a stable unit foundation, and one that fundamentally calls the replication thesis into question. The A4 data point argued that Dutch Bros does not mask cohort maturity through newcomer effects at fresh sites but carries it through structurally sound unit performance across the full life cycle. For the IPO valuation process, this means the scaling projected in investor presentations is historically supported by maturing cohort data.
A5 — Whitespace runway (20/20)
At the IPO date Dutch Bros operated roughly 500 sites. Both analysis runs estimated the addressable US market at up to 7,000 units — based on the format-compatible drive-through market in structurally underserved regions of the American Midwest and West that support the drive-through format culturally and demographically. The whitespace ratio of 500 existing to 7,000 addressable units is the highest among all ten backtest deals and explains the maximum value of 20/20. For IPO investors that runway is a direct derivation of longer-term earnings growth potential: a company with maximum saturation distance can credibly narrate a multi-year EBITDA growth path that dissolves short-term multiple compression through fundamental growth — an argument that investors oriented to long-term capital allocation accept as justifying structurally higher valuations than at saturated platforms.
MTS component analysis B1–B4
B4 — Capital-markets window (25/25)
B4 receives the maximum value. September 2021 was the peak of the post-pandemic IPO cycle: the US central bank sat in a zero-rate regime, institutional investors — facing compressed bond yields — were searching for growth equity, and appetite for consumer-brand IPOs was historically high. That can be read from the simultaneous debut performances of comparable franchise platforms and from the tight HY spreads, which structurally favoured debt-financed purchases. No other moment in the backtest window presented a comparably open capital-markets window, with the exception of Firehouse Subs in the same vintage. The B4 value of 25/25 reflects not merely the favourable environment for a single deal but the structurally widest possible window for hospitality valuation premia inside the entire 2018–2025 observation period.
B1, B2, B3
All three remaining MTS components sat in the upper band. Asset-light franchise models systematically achieved premia over capital-intensive QSR structures in the 2021 valuation environment: the institutional conviction that high-margin royalty streams without capital intensity justify a structural premium claim was broadly accepted. The sub-segment multiples band (B1) reflected that franchise platforms with >15% system-wide EBITDA margin reached benchmarks beyond historical QSR norms at that time. Strategic buyer competition (B3) was intense — several private-equity funds held drive-through roll-out theses actively in their portfolios. For Dutch Bros, the sector read was supplemented by the specific narrative of a regionally dominant brand with demonstrated customer loyalty — a factor that lifted the dealflow heatmap (B2) above the pure sector benchmark.
Zone consistency check
The HERI-40 of 181–184 lands securely in the Platinum zone (≥ 160). Both ORS and MTS sit in the top quartile of the backtest distribution. The realised multiple of >30× post-IPO TTM EBITDA confirms the Platinum classification. Dutch Bros is the only deal in the backtest where all five ORS components and all four MTS components simultaneously sat in the upper third of their respective scales — no single component carried a markdown that would have justified a step-down into the Premium zone.
For model validation, this observation is especially valuable: a Platinum score of 181–184 does not rest on one or two standout signals masking a weak component mix; it rests on area-wide strong performance. That makes the valuation premium structurally robust — it is not explicable by a single outlier but by the consistent strength of every measurement dimension in the index.
Post-deal development and learning implication
Dutch Bros confirmed the HERI-40 prognosis in the following years through sustained strong same-store-sales growth, accelerated national expansion into previously unserved states, and a stable high valuation level in the capital market. The company proved that the A5 runway was not a theoretical construct — unit count grew substantially beyond the 500-unit starting base, and new cohorts showed no performance degradation versus the mature units. That is the strongest form of post-deal validation for the model: not merely a high exit multiple, but an operational development that underpins, through realised metrics, the growth thesis embedded at IPO.
The central methodological learning from the Dutch Bros case: when maximum A5 runway coincides with a peak-B4 environment, valuation premia arise that run beyond fundamentally justifiable levels. That is not a defect in HERI-40 — it is its core finding. The model captures this mechanism correctly because it scores ORS maturity and MTS timing as structurally independent dimensions, whose simultaneous strength has a multiplicative effect on the obtainable premium.
For PE investors and founders this finding implies a mirror-image action logic. An operator with a strong A5 runway bridging an unfavourable B4 period should not force the exit — Platinum potential remains latent as long as the ORS components stay strong. Conversely, an operator with a fading A5 signal should not let a favourable B4 window slip, because the runway argument loses force as market penetration rises. The Dutch Bros transaction is the extreme case in which both signals were simultaneously maximally strong — a constellation that did not recur in this intensity across the 2018–2025 backtest window.
A.4 — Deal decomposition 2: Del Taco / Jack in the Box (2022)
Standard-zone value-erosion warning: predictable correction path despite a realised transaction close
Deal context
Jack in the Box acquired Del Taco in March 2022 for USD 575 million (USD 12.51 per share), corresponding to a transaction multiple of roughly 7.6× synergy-adjusted EBITDA. The retrograde HERI-40 score for the deal is 121–136 (ORS 60–64 / MTS 62–72). Placement in the Standard zone — the lower third of the backtest distribution — is, in this transaction, not the consequence of a single factor failure but of a consistently mid-range profile across both dimensions, further weighted by an unfavourable macro timing. The deal is the reference transaction of the value-trap zone and shows how a realisable exit can nevertheless imply structural value erosion.
ORS component analysis A1–A5
A1 — Flow-through
At the acquisition date Del Taco showed no material flow-through strength. The company operated in an environment of rising energy costs and wage inflation across its core markets, which placed the EBITDA margin under structural pressure. The difference from Dutch Bros is fundamental: Dutch Bros converted revenue growth disproportionately into EBITDA growth, whereas Del Taco absorbed revenue gains through rising operating costs. The result is an A1 profile without a scaling signal — growth does not improve the margin but at best holds it at a stable mid-range. For a PE integration thesis predicated on EBITDA growth through synergies, this starting profile is a structural risk: synergy effects must not merely be additive, they must first offset the A1 headwind before a net value contribution becomes visible.
A2 — Unit-EBITDA dispersion (12/20)
The geographic concentration in the US Southwest — primarily California, Nevada, Arizona, and Colorado — is the strongest ORS markdown in this transaction. Del Taco achieved margins in its core markets at the level of well-run QSR operations. In all other regions the unit economics sat materially below that, pointing to a concept that draws its operational strength from a specific demographic and geographic cluster rather than from a scalable, market-independent replication logic. For Jack in the Box, which modelled synergies through overhead sharing and cross-format expansion into its existing territory, high A2 dispersion is an immediate risk factor: the projected synergies rested on the implicit assumption that Del Taco units in Jack-in-the-Box territories could expand with comparable unit economics. The A2 data base did not support that assumption, which in retrospect makes the synergy-adjusted 7.6× multiple appear optimistically framed.
A3 — Management depth
No pronounced management signal in the analysis — neither outstanding leadership continuity nor critical leadership attrition was identified as a primary driver. The leadership structure was functional but not differentiated enough to justify an elevated A3 score. In the context of the overall profile, the absence of a strong A3 signal is a confirmation of structural mid-range quality: for a company with A1 weakness and A2 risk, exceptional leadership quality could have acted as a compensating force — that was not the case at Del Taco. Management continuity was solid enough to preserve operational stability, but not strong enough to deliver the structural thesis of a transformative growth path.
A4 — Cohort maturity
The older Del Taco units showed stable but stagnant cohort performance. Early saturation signs in established markets, combined with the absence of empirical evidence for successful expansion into new regions, produced an A4 profile without a positive signal for scaling options. The cohort data supplied neither an argument for Premium valuation nor a clear warning signal — they confirmed the picture of an operationally stable but not growth-capable system.
For the M&A logic, this A4 profile means specifically: Jack in the Box could not point to historical Del Taco cohort data demonstrating that older units become disproportionately more profitable after the integration phase. That weakens the integration-value thesis — the assumption that platform integration delivers systematic uplift to the acquired network — because no internal benchmark empirically supports such an effect.
A5 — Whitespace runway
At the acquisition date Del Taco operated roughly 600 sites, concentrated in the US Southwest. A theoretical national whitespace existed — saturation in the core market was not reached. In practice, however, expansion into new regions would have required supply-chain adaptation, the build of regional brand awareness, and operational infrastructure outside the existing distribution cluster, for which no empirical evidence existed. The A5 signal was therefore not maximally negative, but clearly below the level that would mark expansion-driven value uplift as probable.
MTS component analysis B1–B4
B4 — Capital-markets window (12/25)
The 2022 rate rise is the dominant single-factor markdown of this transaction. The US central bank raised its policy rate by a cumulative 425 basis points across the year — the fastest tightening cycle in several decades. High-yield spreads widened accordingly, and acquisition financing conditions for restaurant M&A deteriorated dramatically against the prior year. The timing of the Del Taco deal — March 2022, shortly after the start of the rate cycle — placed the transaction in a rapidly closing capital-markets window. The direct comparison is instructive: Firehouse Subs used the same US restaurant market twelve months earlier and registered MTS 94 versus 62–72 at Del Taco. A timing gap of twelve months explains the MTS delta of more than 22 points and is the quantitative evidence for B4 dominance within the MTS scoring. For transactions where ORS and MTS both sit in the middle band, B4 timing often determines whether a deal materialises as a Standard or a Premium exit.
B1, B2 — 2022 market environment
The market environment for restaurant acquisitions in 2022 was materially less favourable than in 2021. The rate sensitivity of debt-financed restaurant purchases led to a general compression of obtainable multiples, without a correspondingly immediate valuation discount being priced into target companies. Strategic acquirers such as Jack in the Box were navigating an environment where financing costs were rising while dealflow had not yet fully adjusted to the new conditions — a transitional constellation that structurally produces overpayment risk, because sellers still anchor on 2021 multiples while buyer financing has already grown more expensive.
Zone consistency check and value-trap diagnosis
A HERI-40 of 121–136 falls into the Standard zone, lower third. The realised multiple of 7.6× sits at the lower rim of the Standard band and reflects that the M&A advisors involved priced in the operational limitation and the timing risk as well — yet offset them computationally through synergy assumptions. The HERI-40 finding names the mechanism precisely: Standard-zone deals with a B4 markdown from a rate rise are not accidental disappointments, they are a structurally predictable value-correction path. The synergy assumptions on which Jack in the Box supported the purchase price did not materialise in the post-deal phase in the projected form — a classic marker of a value-trap constellation, in which the operating baseline of the target does not carry a Premium growth thesis.
Post-deal development and learning implication
Jack in the Box initiated a comprehensive refranchising programme for Del Taco sites from 2023 onwards and divested the company in 2025 for roughly USD 115 million — a documented value loss of USD 460 million against the USD 575 million purchase price, in under three years (Reuters, 24 April 2024; Restaurant Business Online, 2024).
HERI-40 captures this value erosion structurally. The model does not forecast exit-value uplift for Standard-zone deals that combine a B4 markdown from the rate environment with absent A2 replicability — it forecasts a normalisation to intrinsic operating value. The learning is symmetric for buyers and sellers. For buyers, the model is a warning against synergy premia that simultaneously ignore operating risk and market timing risk. For sellers, a HERI-40 in the Standard zone paired with deteriorating B4 conditions signals that an immediate close is preferable to a later one in an even less favourable rate environment — even where the obtainable multiple disappoints.
A further finding from the Del Taco case concerns the due-diligence logic around synergy adjustments. A multiple that becomes acceptable only after synergy adjustment presupposes the full realisation of the synergies as a base assumption — not as an upside scenario. When the target's ORS baseline shows structurally mid-range A2 replicability, the synergy adjustment is methodologically questionable: the assumed cross-format synergies rest on a growth path that the target's operational data do not support. HERI-40 makes the contradiction explicit by carrying A2 as an independent valuation dimension that cannot be overwritten by buyer-side synergy expectations.
A.5 — Deal decomposition 3: Vapiano (2020)
Distress case study: insolvency sequence from negative A1 spiral, A3 erosion, and total MTS collapse
Deal context
Vapiano filed for insolvency in May 2020. There is no transactional exit — company assets were sold piecemeal, without a documented aggregate sale price above the nominal value of outstanding liabilities becoming known. The retrograde HERI-40 score for the insolvency period is 35–65 (ORS 30–35 / MTS 25–30) — the lowest value among all ten backtest deals and the only DACH-origin insolvency in the set. The analysis that follows is deliberately analytical and free of valuation: the Vapiano case is not the failure of a specific brand concept, it is a generic distress path whose sequence carries relevance for any multi-unit operator exhibiting comparable operational patterns.
ORS component analysis A1–A5
A1 — Flow-through (3/20)
The strongest ORS warning signal of the entire backtest series. Vapiano posted negative flow-through across several consecutive quarters: operating costs rose structurally faster than revenue from 2018 onwards. The concept combined open-stage fresh-cook cuisine with a multi-step ordering process — capital-intensive, labour-intensive, and with high kitchen variability depending on site utilisation and daypart. At a growing network, staff costs, rent costs, and logistical complexity rose faster than revenue, pointing to a fundamental scaling problem: the concept worked in urban high-traffic locations with high area productivity, but could not build a flow-through mechanism translating revenue growth into EBITDA growth. The A1 value of 3/20 is not a single-quarter read but the confirmation of a trend that accumulated over multiple reporting periods and was legible in the consolidated accounts. This is the early warning signature the model prioritises: not the insolvency itself, but the A1 trend as its precursor.
A2 — Unit-EBITDA dispersion
Unit economics across the international network were materially heterogeneous. A handful of German flagship sites in high-traffic inner-city locations posted positive EBITDA contributions and created the impression of a functioning concept. Expansion into new markets — UK and US especially — was linked to meaningful negative EBITDA contributions. The dispersion carried a problematic consequence for system governance: profitable units chronically subsidised loss-making sites in expansion markets, without the mechanism being transparently represented in capital allocation. The pandemic shock in March 2020 removed this internal cross-subsidisation at a stroke: forced closures hit profitable and loss-making units alike and withdrew from the system the only internal cashflow source that had to that point enabled continuation.
A3 — Management depth (4/20)
The second severe ORS markdown. Vapiano recorded pronounced CEO attrition in the years preceding insolvency — several leadership changes in short succession prevented the development of a consistent strategic line. That leadership instability is not merely an operational risk category but an indicator of structural decision-making weakness in critical phases: restructuring plans were initiated and abandoned before operational completion; directional decisions between aggressive expansion and operational consolidation followed leadership changes without a consistent corporate logic remaining discernible. An A3 score of 4/20 signals that the leadership structure was unable to address the operational problems identified in A1 through strategic course correction — precisely during the phase in which such an intervention would still have had effect. The combination of A1 warning signal and A3 erosion is the sequence associated without exception with distress outcomes across the backtest series.
A4, A5 — Overextension without a profitability foundation
Vapiano pursued simultaneous international expansion — DACH, UK, US, and Asian markets — without having secured operational profitability in the existing markets as a foundation. The theoretically present A5 whitespace runway, which in a different context would have been scored positively, morphed through the missing A4 cohort maturity into capital binding without matching earnings generation. New markets were opened before the logic of a profitable and replicable unit model had been documented. The A4 cohort data showed no stable maturity curve justifying expansion — instead, unit performance was volatile and site-dependent even in established markets. The pattern is structural: A5 runway without an A4 foundation is not growth potential, it is a capital-burn risk.
MTS component analysis B1–B4
B4 — Capital-markets window (2/25)
The lowest value across the entire backtest. March 2020 marked the collapse of the IPO and M&A market for restaurant assets: capital markets lost over 30 percent of their value in a matter of weeks, bank financing for hospitality assets was frozen or heavily conditioned at many institutions, and the entire restaurant industry faced operational constraints of historic scale. A capital-markets window for a restaurant exit factually did not exist at that moment — even a company with a sound ORS base would not have been able to execute an attractive transactional exit. At Vapiano, the worst possible market timing met the worst possible operating starting position: a rare case in which both dimensions simultaneously reached their lower extremum.
B1, B2, B3 — MTS total collapse
All three remaining MTS components sat at the lowest level of the backtest distribution. Sector dealflow collapsed; strategic interest in distressed restaurant assets did exist among opportunistic buyers, but aimed exclusively at liquidation prices — no structured M&A process with a competitive bidder field was realisable under the prevailing conditions. The B1 multiples band for distressed assets had compressed to a level containing no platform premium; even viable units were being priced at asset values rather than platform values. The dealflow heatmap (B2) was factually frozen for proactive acquisitions — no PE fund ran auction processes for restaurant platforms in March/April 2020 that were not already bound by LOI.
The contrast with the Firehouse Subs case illustrates MTS mechanics at full scale: Firehouse Subs carried MTS 94 in the 2021 peak and could thereby transform a mid-range ORS of 69–78 into a Premium outcome (~20× EBITDA) — there MTS compensated for an operational mid-class position. At Vapiano, neither ORS nor MTS sat in a band where compensation would have been possible. The model shows in this case not a compensatory interaction but an additive deterioration of both dimensions: weak ORS multiplied with minimal MTS does not yield a moderate result, it yields no transactional result.
Zone consistency check
A HERI-40 of 35–65 falls deep into the High-Risk zone (< 100). No transactional exit was realisable at this score. The HERI-40 framework explicitly classifies the High-Risk zone as not primarily addressable through exit optimisation — as set out in Section 6.4 of the paper, the framework refers this zone to specialised restructuring expertise outside the standard M&A process. The analytical task shifts from exit preparation to insolvency avoidance and damage limitation for the stakeholders involved.
The score range 35–65 reflects the uncertainty in reconstruction: the lower bound (35) corresponds to the case in which ORS and MTS simultaneously show their minimum values; the upper bound (65) reflects scenarios in which individual site clusters showed short-lived stronger cashflows. The practical implication is identical in both scenarios: no PE financeability, no competitive bidder process, no structured exit.
Post-deal development and learning implication
The May 2020 insolvency confirmed the HERI-40 classification. In the following months individual Vapiano sites were taken over by other operators or continued as stand-alone concepts under new brands. A whole-company sale as an operating platform — the only route to a realisation above the nominal value of liabilities — did not occur. The documented residual value sat materially below the nominal value of outstanding liabilities, affecting creditors and investors in the order of the insolvency hierarchy.
The Vapiano case is not an idiosyncratic failure of a specific conceptual flaw. It is a generic distress path with a reproducible sequence: a negative A1 spiral, in which operating costs structurally exceed revenue and accumulate over quarters — followed by A3 erosion, in which leadership instability prevents the required countersteer — followed by the MTS floor, in which no market window is available for a liquidity event. Any multi-unit operator posting negative flow-through across three or more consecutive quarters while exhibiting signs of management instability sits on the entry ramp of this path — regardless of whether the cause is a concept flaw, an expansion overshoot, or an external shock.
The earliest-possible intervention sits in the A1 phase: when an operator documents negative flow-through across two quarters, that is the moment at which a restructuring mandate still holds strategic options open. From the third negative quarter combined with A3 erosion onwards, the intervention option narrows structurally. That sequence is the single strongest learning of the backtest set.
A.6 — Methodological limitations
Three material limitations of this backtest analysis are relevant for the interpretation of the findings.
1. Private-deal data base
For L'Osteria / McWin and Jersey Mike's / Blackstone, no internal EBITDA decompositions were available. The HERI-40 reconstructions for those deals rest on public statements, franchise disclosure documents (FDD Item 19), and press releases — not on audited financial data or quality-of-earnings reports. The consensus score ranges reported reflect that uncertainty through wider spreads. Conclusions drawn from these transactions are therefore deliberately conservative in substance: where the material permits only a directional statement, it is reported as such rather than treated as a point value.
2. DACH sample size
Only two of the ten backtest deals — Vapiano and L'Osteria — are European transactions with direct DACH relevance. A separate European calibration of the thresholds (100 / 130 / 160) is not feasible on this data base. The more conservative MTS bandwidth recommended for DACH applications in Section 5.4 of the paper reflects that limitation: the current thresholds were calibrated primarily against a US-dominated transaction universe. For European deals — where the capital-markets window is typically tighter and the availability of PE capital for mid-market hospitality structurally lower than in the United States — a more restrictive MTS application is indicated.
As a minimum DACH extension, five to eight documented transactions from the DACH/EU area (McWin portfolio, hospitality PE exits in Germany / Austria / Switzerland, AHGZ-documented brand acquisitions) would be sufficient to enable a regional MTS recalibration. Until that data base is available, the conservative application note formulated in Section 5.4 applies.
3. Calibration openness on A2 weighting
Both deep-research runs recommended a weighting upgrade for A2 (unit-EBITDA dispersion): the second run proposed raising A2 to 30 points while reducing A5 (whitespace runway) to 10 points. The current equal weighting A1–A5 (20 points each) is the conservative default calibration of the index in its present version. The option remains open: a weighting shift toward A2 would increase the model's discriminatory power in operator assessments in saturated markets, while A5 retains its full explanatory content in frontier-market situations.
The decision on a weighting adjustment is not trivial: raising A2 to 30 points would, at deals such as Firehouse Subs — where A2 exhibited discernible dispersion — shift the ORS downward and tend to correct the Platinum classification into the Premium zone. Whether that correction more accurately represents post-deal reality is an empirical question answerable with an expanded data base — more DACH transactions with QofE visibility in particular. The current equal weighting is the model-conservative choice for a first validation round; a review against an expanded data base is explicitly scheduled as a later iteration.
Related research
- HERI-40 Section 1: Executive Summary
- HERI-40 Section 2: Market Context 2026
- The roll-up playbook in European hospitality: where multiple arbitrage still works
- Multiple compression in mid-market foodservice: reading the 2024–2025 corridor
Sources
- SEC-EDGAR filings: Dutch Bros Inc. (S-1, subsequent 10-K and 10-Q filings, 2021–2025)
- SEC-EDGAR filings: CAVA Group Inc. (S-1, subsequent 10-K and 10-Q filings, 2023–2025)
- SEC-EDGAR filings: BurgerFi International Inc.
- SEC-EDGAR filings: Tattooed Chef Inc.
- SEC-EDGAR filings: Del Taco Restaurants Inc. and Jack in the Box Inc.
- S&P Global Ratings, "Subway Funding LLC", 29 May 2024 (whole-business securitisation analysis)
- Franchise Disclosure Documents (FDD Item 19): Jersey Mike's, Firehouse Subs, Subway, Dutch Bros
- Reuters, 24 April 2024: Tropical Smoothie Cafe sale to Blackstone; subsequent reporting on Del Taco divestiture
- Restaurant Business Online, 2024: Del Taco refranchising and divestiture reporting
- Wall Street Journal, April 2024: Secondary-buyout reporting, US hospitality
- Bloomberg, 12 September 2025: Black Rock Coffee Bar (BRCB) Nasdaq IPO (contextual reference, Section 2)
- Houlihan Lokey, H1 2025 Hospitality Sector Update
- Focus Investment Banking, Agribusiness Quarterly Q3 2025
- Hyde Park Capital, Winter 2024 Report
- PitchBook, European Buyout Update, January 2026
- Mergermarket: European hospitality deal volumes, H1 2025